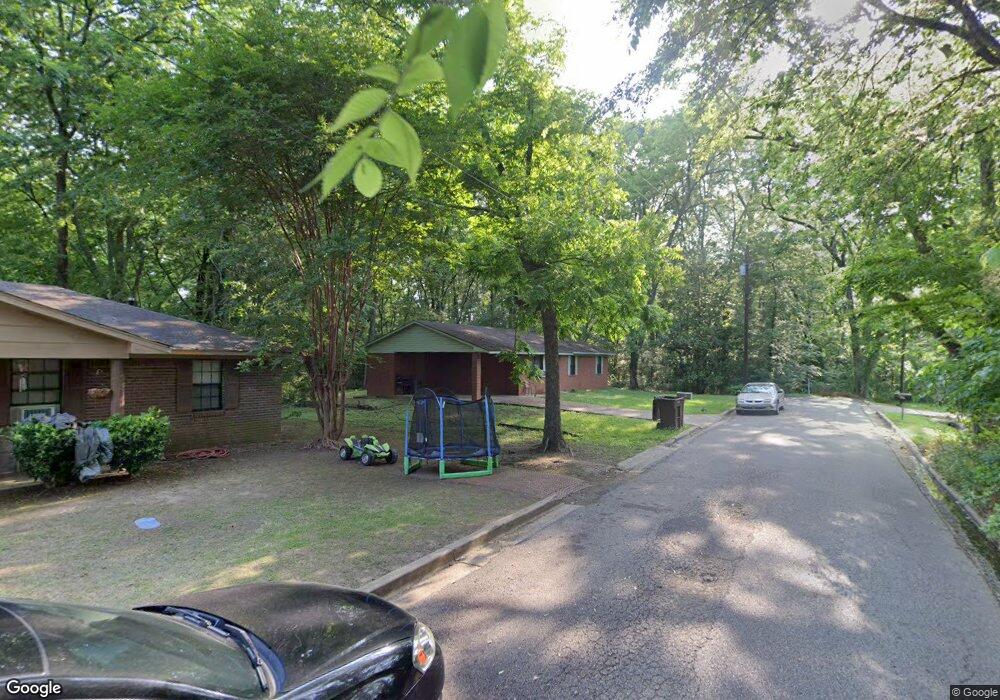
226 W Morrow St West Point, MS 39773
Estimated Value: $63,000 - $113,089
3
Beds
--
Bath
1,198
Sq Ft
$81/Sq Ft
Est. Value
About This Home
This home is located at 226 W Morrow St, West Point, MS 39773 and is currently estimated at $97,272, approximately $81 per square foot. 226 W Morrow St is a home located in Clay County with nearby schools including East Side Elementary School, West Clay Elementary School, and Church Hill Elementary School.
Ownership History
Date
Name
Owned For
Owner Type
Purchase Details
Closed on
Dec 19, 2018
Sold by
Mcclenton Investments Llc
Bought by
Mc & J Investments Llc
Current Estimated Value
Create a Home Valuation Report for This Property
The Home Valuation Report is an in-depth analysis detailing your home's value as well as a comparison with similar homes in the area
Home Values in the Area
Average Home Value in this Area
Purchase History
| Date | Buyer | Sale Price | Title Company |
|---|---|---|---|
| Mc & J Investments Llc | -- | -- |
Source: Public Records
Tax History Compared to Growth
Tax History
| Year | Tax Paid | Tax Assessment Tax Assessment Total Assessment is a certain percentage of the fair market value that is determined by local assessors to be the total taxable value of land and additions on the property. | Land | Improvement |
|---|---|---|---|---|
| 2024 | $490 | $9,036 | $1,170 | $7,866 |
| 2023 | $1,132 | $7,565 | $1,170 | $6,395 |
| 2022 | $422 | $7,565 | $1,170 | $6,395 |
| 2021 | $417 | $7,565 | $1,170 | $6,395 |
| 2020 | $419 | $7,565 | $1,170 | $6,395 |
| 2019 | $387 | $7,506 | $1,170 | $6,336 |
| 2018 | $375 | $7,506 | $1,170 | $6,336 |
| 2017 | $371 | $7,506 | $1,170 | $6,336 |
| 2016 | $368 | $7,506 | $1,170 | $6,336 |
| 2015 | $365 | $7,263 | $1,170 | $6,093 |
| 2014 | $345 | $7,263 | $1,170 | $6,093 |
| 2013 | $345 | $7,263 | $1,170 | $6,093 |
Source: Public Records
Map
Nearby Homes
- 63 Clay St
- 218 Lewellen St
- 0 Mississippi 50
- 530 E Morrow St
- 318 Progress St
- 564 E Morrow St
- 26788 E Main St
- 0 Us Hwy 45a Unit 4033641
- 0 Us Hwy 45a Unit 22-3720
- 26852 E Main St
- 184 Tournament St
- 98 Court St
- 159 Washington St
- 229 S Division St
- 228 S Division St
- 399 Lone Oak Dr
- 206 S Division St
- 26596 E Main St
- 27045 E Main St
- 1104 E Broad St
- 220 W Morrow St
- 147 W Morrow St
- 233 W Morrow St
- 79 W Morrow St
- 129 W Morrow St
- 555 Critz St
- 555 Critz St
- 125 W Morrow St
- 252 W Half Mile St
- 230 W Half Mile St
- 226 W Half Mile St
- 220 W Half Mile St
- 144 W Morrow St
- 545 Critz St
- 525 Critz St
- 540 Critz St
- 119 W Morrow St
- 124 W Morrow St
- 118 W Morrow St
- 517 Critz St