
Seller's Agent in 2025
Joan Vander Giessen
Windermere RE Whatcom, Inc.
(360) 734-7500
17 in this area
26 Total Sales

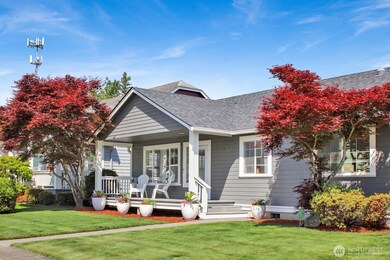
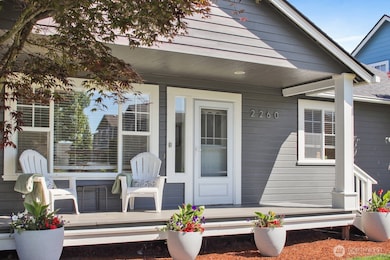
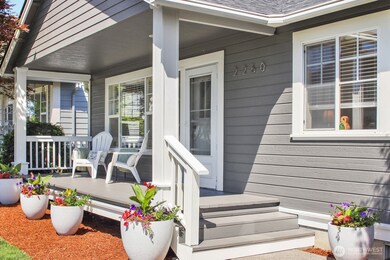


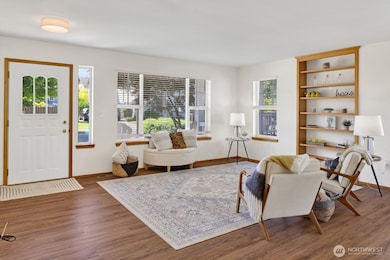
This home showcases a harmonious blend of thoughtful updates & classic design--recently refreshed to meet modern tastes. Notable interior enhancements include new vinyl laminate flooring, updated lighting fixtures, new blinds, fresh interior paint, & revitalized kitchen complete w/brand-new appliances. Additional features include a 2009-installed furnace & heat pump, as well as an attached 2-car garage for added convenience. Exterior renovation: partial siding replacement, newly renovated front porch, fresh exterior paint, a brand-new roof! Ideally positioned near local parks & amenities, this move-in ready home offers both comfort & curb appeal in an unbeatable location. An exceptional opportunity on the best street in Greenfield Village!
Last Agent to Sell the Property
Windermere RE Whatcom, Inc. License #34909 Listed on: 05/28/2025
Source: Northwest Multiple Listing Service (NWMLS)
MLS#: 2374059
| Date | Type | Sale Price | Title Company |
|---|---|---|---|
| Warranty Deed | $525,000 | Chicago Title |
| Date | Status | Loan Amount | Loan Type |
|---|---|---|---|
| Open | $420,000 | New Conventional |
| Date | Event | Price | List to Sale | Price per Sq Ft |
|---|---|---|---|---|
| 06/20/2025 06/20/25 | Sold | $525,000 | 0.0% | $402 / Sq Ft |
| 05/29/2025 05/29/25 | Pending | -- | -- | -- |
| 05/28/2025 05/28/25 | For Sale | $525,000 | -- | $402 / Sq Ft |
| Year | Tax Paid | Tax Assessment Tax Assessment Total Assessment is a certain percentage of the fair market value that is determined by local assessors to be the total taxable value of land and additions on the property. | Land | Improvement |
|---|---|---|---|---|
| 2025 | $3,307 | $452,746 | $218,260 | $234,486 |
| 2024 | $3,112 | $435,739 | $194,000 | $241,739 |
| 2023 | $3,112 | $432,441 | $200,000 | $232,441 |
| 2022 | $2,936 | $384,992 | $140,798 | $244,194 |
| 2021 | $2,880 | $318,171 | $116,360 | $201,811 |
| 2020 | $2,523 | $284,089 | $103,896 | $180,193 |
| 2019 | $2,245 | $260,571 | $95,394 | $165,177 |
| 2018 | $2,453 | $237,615 | $86,900 | $150,715 |
| 2017 | $2,109 | $213,280 | $78,000 | $135,280 |
| 2016 | $1,994 | $194,923 | $68,200 | $126,723 |
| 2015 | $1,768 | $183,280 | $65,596 | $117,684 |
| 2014 | -- | $177,068 | $63,364 | $113,704 |
| 2013 | -- | $175,704 | $62,000 | $113,704 |
Seller's Agent in 2025
Joan Vander Giessen
Windermere RE Whatcom, Inc.
(360) 734-7500
17 in this area
26 Total Sales
Buyer's Agent in 2025
Stacy Osterkamp
Windermere Corporate
(360) 927-3084
2 in this area
39 Total Sales
Source: Northwest Multiple Listing Service (NWMLS)
MLS Number: 2374059
APN: 400316-345533-0000
Disclaimer: Certain information contained herein is derived from information provided by parties other than Homes.com. All information provided is deemed reliable, but is not guaranteed to be accurate and should be independently verified.
![]() All data is obtained from various sources and may not have been verified by broker or MLS GRID. Supplied Open House Information is subject to change without notice. All information should be independently reviewed and verified for accuracy. Properties may or may not be listed by the office/agent presenting the information. Listing information is provided by the Northwest Multiple Listing Service (NWMLS). Property information is based on available data that may include MLS information, county records, and other sources. Listings marked with the 3 tree icon and provided by NWMLS. All properties are subject to prior sale or withdrawal. IDX information is provided exclusively for consumers’ personal noncommercial use, that it may not be used for any purpose other than to identify prospective properties consumers may be interested in purchasing, that the data is deemed reliable but is not guaranteed by MLS GRID. ©2026 NWMLS.
All data is obtained from various sources and may not have been verified by broker or MLS GRID. Supplied Open House Information is subject to change without notice. All information should be independently reviewed and verified for accuracy. Properties may or may not be listed by the office/agent presenting the information. Listing information is provided by the Northwest Multiple Listing Service (NWMLS). Property information is based on available data that may include MLS information, county records, and other sources. Listings marked with the 3 tree icon and provided by NWMLS. All properties are subject to prior sale or withdrawal. IDX information is provided exclusively for consumers’ personal noncommercial use, that it may not be used for any purpose other than to identify prospective properties consumers may be interested in purchasing, that the data is deemed reliable but is not guaranteed by MLS GRID. ©2026 NWMLS.
Based on information submitted to the MLS GRID
Ask me questions while you tour the home.