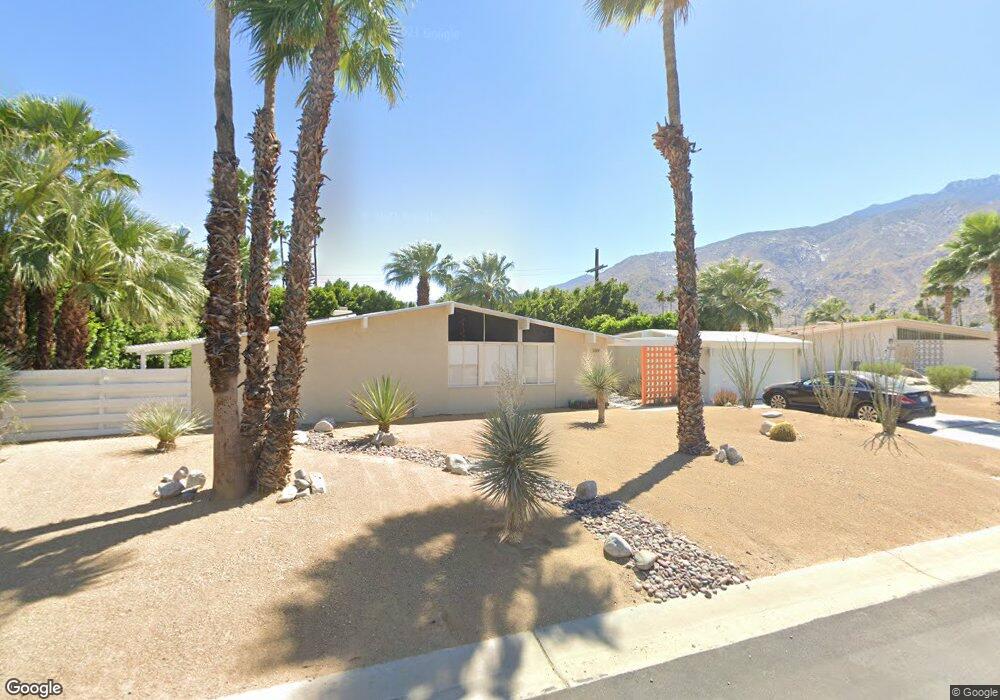
2260 N Indian Canyon Dr Unit A Palm Springs, CA 92262
Vista Norte NeighborhoodEstimated Value: $331,000 - $384,000
3
Beds
2
Baths
1,116
Sq Ft
$321/Sq Ft
Est. Value
About This Home
This home is located at 2260 N Indian Canyon Dr Unit A, Palm Springs, CA 92262 and is currently estimated at $358,045, approximately $320 per square foot. 2260 N Indian Canyon Dr Unit A is a home located in Riverside County with nearby schools including Vista Del Monte Elementary School, Raymond Cree Middle School, and Palm Springs High School.
Ownership History
Date
Name
Owned For
Owner Type
Purchase Details
Closed on
Nov 18, 2009
Sold by
U S Bank National Association
Bought by
Doll Frank
Current Estimated Value
Home Financials for this Owner
Home Financials are based on the most recent Mortgage that was taken out on this home.
Original Mortgage
$42,900
Interest Rate
4.78%
Mortgage Type
New Conventional
Purchase Details
Closed on
Jun 30, 2009
Sold by
Harmon Larry and Harmon Vicki
Bought by
Us Bank National Association
Purchase Details
Closed on
Feb 8, 2002
Sold by
Clark Cindy Ilene and Aron Cindy Ilene
Bought by
Harmon Larry and Harmon Vicki
Home Financials for this Owner
Home Financials are based on the most recent Mortgage that was taken out on this home.
Original Mortgage
$63,050
Interest Rate
7.08%
Mortgage Type
FHA
Create a Home Valuation Report for This Property
The Home Valuation Report is an in-depth analysis detailing your home's value as well as a comparison with similar homes in the area
Home Values in the Area
Average Home Value in this Area
Purchase History
| Date | Buyer | Sale Price | Title Company |
|---|---|---|---|
| Doll Frank | $93,000 | Fidelity National Title Co | |
| Us Bank National Association | $67,624 | None Available | |
| Harmon Larry | $65,000 | Orange Coast Title | |
| Clark Cindy Ilene | -- | Orange Coast Title |
Source: Public Records
Mortgage History
| Date | Status | Borrower | Loan Amount |
|---|---|---|---|
| Previous Owner | Doll Frank | $42,900 | |
| Previous Owner | Harmon Larry | $63,050 |
Source: Public Records
Tax History Compared to Growth
Tax History
| Year | Tax Paid | Tax Assessment Tax Assessment Total Assessment is a certain percentage of the fair market value that is determined by local assessors to be the total taxable value of land and additions on the property. | Land | Improvement |
|---|---|---|---|---|
| 2025 | $4,630 | $367,200 | $142,800 | $224,400 |
| 2023 | $4,630 | $115,239 | $28,804 | $86,435 |
| 2022 | $1,621 | $112,981 | $28,240 | $84,741 |
| 2021 | $1,591 | $110,767 | $27,687 | $83,080 |
| 2020 | $1,528 | $109,633 | $27,404 | $82,229 |
| 2019 | $1,504 | $107,484 | $26,867 | $80,617 |
| 2018 | $1,478 | $105,378 | $26,341 | $79,037 |
| 2017 | $1,458 | $103,313 | $25,825 | $77,488 |
| 2016 | $1,420 | $101,288 | $25,319 | $75,969 |
| 2015 | $1,351 | $99,769 | $24,940 | $74,829 |
| 2014 | $1,317 | $97,816 | $24,452 | $73,364 |
Source: Public Records
Map
Nearby Homes
- 2252 N Indian Canyon Dr Unit E
- 205 The River
- 2120 N Indian Canyon Dr Unit D
- 2211 N Starr Rd
- 179 The River
- 2303 N Indian Canyon Dr
- 2272 N Starr Rd
- 444 E Glen Cir N
- 325 E Via Escuela Unit 324
- 600 E Alexander Way
- 2023 N Via Miraleste Unit 1022
- 2101 N Berne Dr
- 200 W Via Olivera
- 2501 N Indian Canyon Dr Unit 635
- 1865 N Via Miraleste Unit 1822
- 2197 Jacques Dr
- 576 E Desert Holly Cir
- 200 E Racquet Club Rd Unit 69
- 200 E Racquet Club Rd Unit 72
- 200 E Racquet Club Rd Unit 60
- 2260 N Indian Canyon Dr Unit D
- 2260 N Indian Canyon Dr Unit B
- 2260 N Indian Ave Unit B
- 2260 N Indian Ave Unit E
- 2260 N Indian Canyon Dr
- 2260 N Indian Ave Unit A
- 2260 N Indian Ave Unit D
- 2260 N Indian Canyon Dr Unit F
- 2260 N Indian Canyon Dr Unit E
- 2260 N Indian Canyon Dr Unit D
- 2260 N Indian Canyon Dr Unit C
- 2260 N Indian Canyon Dr Unit B
- 2260 N Indian Canyon Dr Unit A
- 2252 N Indian Canyon Dr Unit E
- 2252 N Indian Canyon Dr Unit D
- 2252 N Indian Canyon Dr
- 2252 N Indian Canyon Dr Unit G
- 2252 N Indian Canyon Dr Unit F
- 2252 N Indian Canyon Dr Unit D
- 2252 N Indian Canyon Dr Unit C