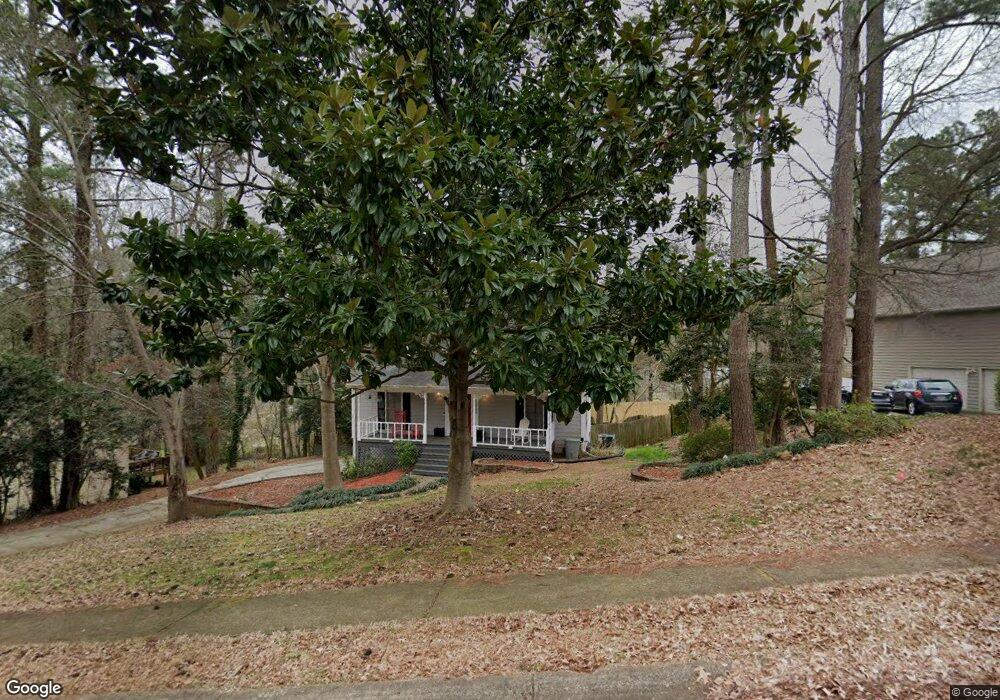
2260 Remington Ct NE Marietta, GA 30066
Sandy Plains NeighborhoodEstimated Value: $387,164 - $482,000
3
Beds
3
Baths
1,764
Sq Ft
$239/Sq Ft
Est. Value
About This Home
This home is located at 2260 Remington Ct NE, Marietta, GA 30066 and is currently estimated at $421,791, approximately $239 per square foot. 2260 Remington Ct NE is a home located in Cobb County with nearby schools including Rocky Mount Elementary School, Mabry Middle School, and Lassiter High School.
Ownership History
Date
Name
Owned For
Owner Type
Purchase Details
Closed on
Jul 26, 2012
Sold by
Clements Catherine
Bought by
Simonson Catherine E
Current Estimated Value
Home Financials for this Owner
Home Financials are based on the most recent Mortgage that was taken out on this home.
Original Mortgage
$173,900
Outstanding Balance
$120,098
Interest Rate
3.68%
Mortgage Type
New Conventional
Estimated Equity
$301,693
Purchase Details
Closed on
Dec 1, 2003
Sold by
Thomas Simon and Thomas Karen
Bought by
Clements Catherine
Home Financials for this Owner
Home Financials are based on the most recent Mortgage that was taken out on this home.
Original Mortgage
$184,000
Interest Rate
5.64%
Mortgage Type
New Conventional
Purchase Details
Closed on
Jun 29, 2000
Sold by
Clayton John A and Clayton Susan M
Bought by
Thomas Simon and Thomas Karen
Home Financials for this Owner
Home Financials are based on the most recent Mortgage that was taken out on this home.
Original Mortgage
$125,000
Interest Rate
8.3%
Mortgage Type
New Conventional
Create a Home Valuation Report for This Property
The Home Valuation Report is an in-depth analysis detailing your home's value as well as a comparison with similar homes in the area
Home Values in the Area
Average Home Value in this Area
Purchase History
| Date | Buyer | Sale Price | Title Company |
|---|---|---|---|
| Simonson Catherine E | -- | -- | |
| Clements Catherine | $184,000 | -- | |
| Thomas Simon | $125,000 | -- |
Source: Public Records
Mortgage History
| Date | Status | Borrower | Loan Amount |
|---|---|---|---|
| Open | Simonson Catherine E | $173,900 | |
| Previous Owner | Clements Catherine | $184,000 | |
| Previous Owner | Thomas Simon | $125,000 |
Source: Public Records
Tax History Compared to Growth
Tax History
| Year | Tax Paid | Tax Assessment Tax Assessment Total Assessment is a certain percentage of the fair market value that is determined by local assessors to be the total taxable value of land and additions on the property. | Land | Improvement |
|---|---|---|---|---|
| 2025 | $3,715 | $161,764 | $40,000 | $121,764 |
| 2024 | $3,718 | $161,764 | $40,000 | $121,764 |
| 2023 | $2,321 | $122,368 | $30,000 | $92,368 |
| 2022 | $2,886 | $122,368 | $30,000 | $92,368 |
| 2021 | $2,314 | $96,220 | $28,800 | $67,420 |
| 2020 | $2,314 | $96,220 | $28,800 | $67,420 |
| 2019 | $2,314 | $96,220 | $28,800 | $67,420 |
| 2018 | $2,187 | $90,420 | $28,800 | $61,620 |
| 2017 | $1,881 | $79,748 | $24,000 | $55,748 |
| 2016 | $1,885 | $79,748 | $24,000 | $55,748 |
| 2015 | $1,472 | $59,440 | $17,200 | $42,240 |
| 2014 | $1,485 | $59,440 | $0 | $0 |
Source: Public Records
Map
Nearby Homes
- 4499 Browning Ct NE
- 2603 Chadwick Rd
- 2610 Chadwick Rd
- 2402 Woodbridge Dr
- 4509 N Landing Dr
- 4709 Trickum Rd NE
- 4509 N Bay Ct
- 4056 Longford Dr NE
- 4592 N Landing Dr
- 4050 Idlewilde Meadows Dr NE
- 2256 Turtle Club Dr NE Unit 1
- 4797 North Trail
- 4799 North Trail
- 2124 Lassiter Field Dr NE
- 4314 Keheley Lake Ct NE
- 1765 Blackwillow Dr
- 2262 Remington Ct NE
- 2258 Remington Ct NE
- 0 Remington Ct NE Unit 8213996
- 0 Remington Ct NE Unit 8791500
- 0 Remington Ct NE Unit 8929779
- 0 Remington Ct NE Unit 7176821
- 0 Remington Ct NE
- 4388 Brandon Cove NE Unit 1
- 2256 Remington Ct NE
- 2264 Remington Ct NE
- 4382 Brandon Cove NE
- 2269 Remington Ct NE
- 2261 Remington Ct NE
- 2254 Remington Ct NE
- 4383 Brandon Cove NE
- 2266 Remington Ct NE
- 4376 Brandon Cove NE Unit 1
- 2271 Remington Ct NE
- 4377 Brandon Cove NE
- 2268 Remington Ct NE