M
Landlord's Agent in 2025
Maria Gudino
Zoomit
(602) 765-7575
6 Total Sales
Estimated Value: $467,700 - $493,000
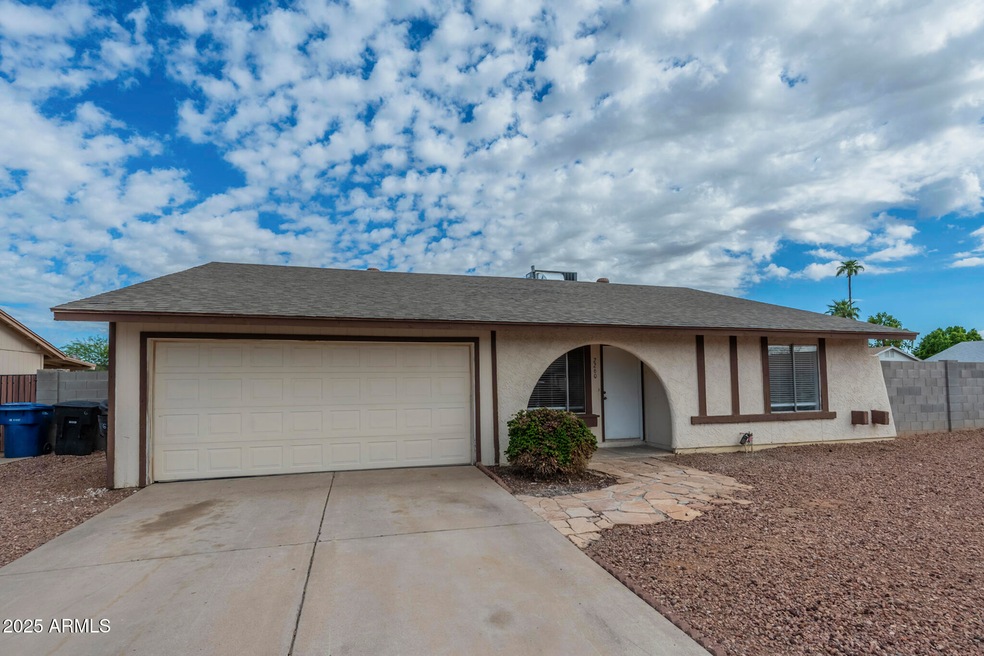
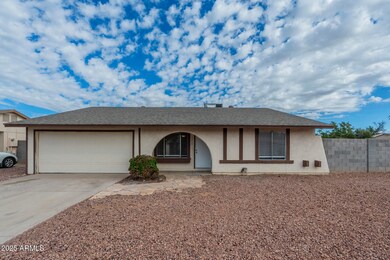
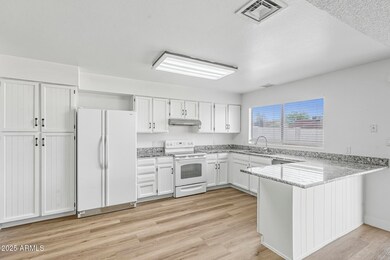
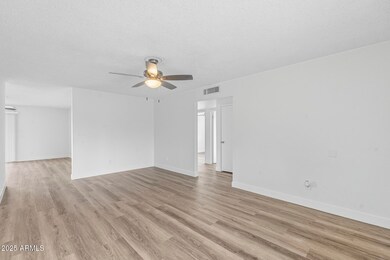
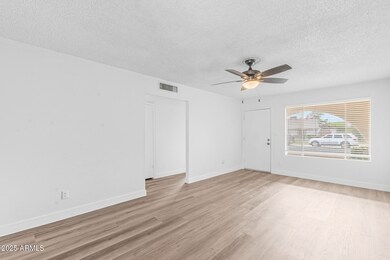
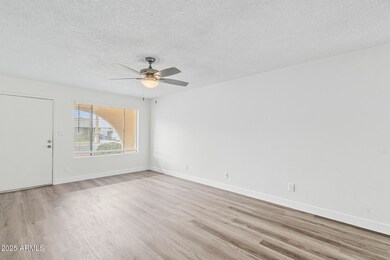
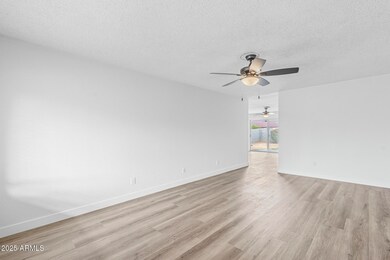
Wonderful East Valley Home! 4bedroom 2 Bath with Pool Discover this charming 4-bedroom, 1.5-bath home nestled in the heart of Mesa, AZ. Designed for both comfort and convenience, this residence offers the perfect blend of indoor and outdoor living. NO HOA! Enjoy the freedom of renting without extra restrictions.
| Date | Buyer | Sale Price | Title Company |
|---|---|---|---|
| Onza Equity Llc | -- | None Available | |
| Lail Charles | $107,500 | American Title Insurance | |
| U S Bank National Assn | $107,900 | First Financial Title Agency | |
| Rivera Melinda H | -- | -- | |
| Rivera Jose L | $101,900 | Capital Title Agency |
| Date | Status | Borrower | Loan Amount |
|---|---|---|---|
| Previous Owner | Rivera Jose L | $96,805 |
| Date | Event | Price | List to Sale | Price per Sq Ft |
|---|---|---|---|---|
| 10/15/2025 10/15/25 | Rented | $2,100 | -4.3% | -- |
| 09/25/2025 09/25/25 | Price Changed | $2,195 | -4.4% | $1 / Sq Ft |
| 09/22/2025 09/22/25 | Price Changed | $2,295 | -3.2% | $1 / Sq Ft |
| 09/17/2025 09/17/25 | For Rent | $2,370 | -- | -- |
| Year | Tax Paid | Tax Assessment Tax Assessment Total Assessment is a certain percentage of the fair market value that is determined by local assessors to be the total taxable value of land and additions on the property. | Land | Improvement |
|---|---|---|---|---|
| 2025 | $1,667 | $16,895 | -- | -- |
| 2024 | $1,672 | $16,090 | -- | -- |
| 2023 | $1,672 | $34,010 | $6,800 | $27,210 |
| 2022 | $1,637 | $25,300 | $5,060 | $20,240 |
| 2021 | $1,657 | $23,460 | $4,690 | $18,770 |
| 2020 | $1,636 | $21,460 | $4,290 | $17,170 |
| 2019 | $1,528 | $19,650 | $3,930 | $15,720 |
| 2018 | $1,467 | $16,910 | $3,380 | $13,530 |
| 2017 | $1,423 | $15,460 | $3,090 | $12,370 |
| 2016 | $1,397 | $14,780 | $2,950 | $11,830 |
| 2015 | $1,313 | $13,610 | $2,720 | $10,890 |
M
Landlord's Agent in 2025
Maria Gudino
Zoomit
(602) 765-7575
6 Total Sales
D
Landlord's Co-Listing Agent in 2025
David Quintero
Zoomit
(623) 340-9390
62 Total Sales
Source: Arizona Regional Multiple Listing Service (ARMLS)
MLS Number: 6921447
APN: 302-05-971
Disclaimer: Certain information contained herein is derived from information provided by parties other than Homes.com. All information provided is deemed reliable, but is not guaranteed to be accurate and should be independently verified.
![]() All information should be verified by the recipient and none is guaranteed as accurate by ARMLS
All information should be verified by the recipient and none is guaranteed as accurate by ARMLS
Listing Information presented by local MLS brokerage: Ten-X, local REALTOR®- Arlene Richardson - (888)-952-6393
