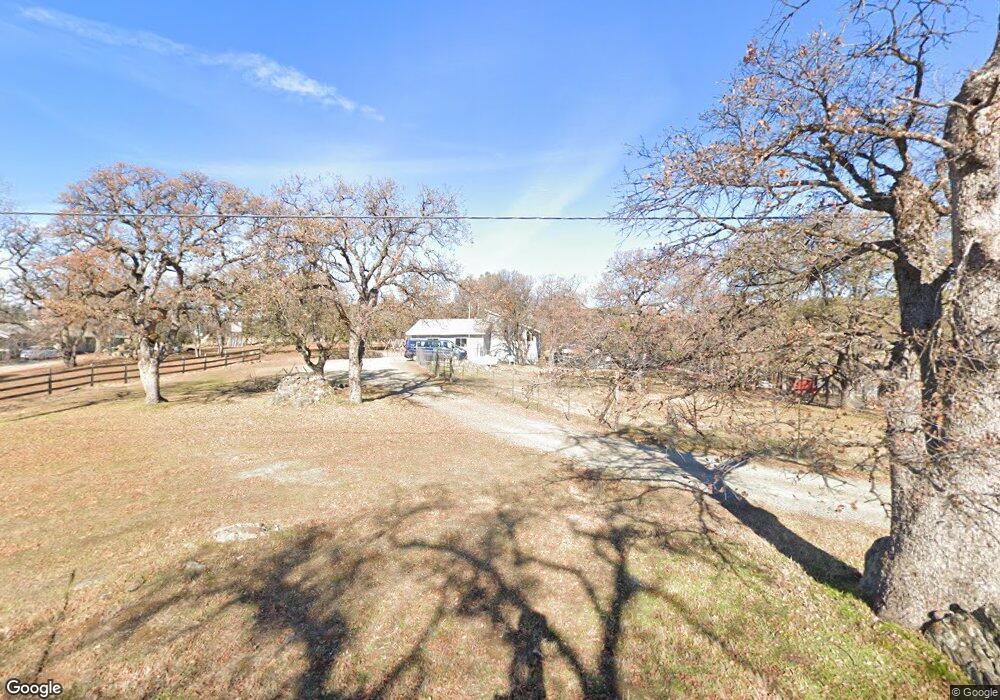
2261 Burrmac Ln Placerville, CA 95667
Estimated Value: $560,000 - $931,000
2
Beds
2
Baths
1,652
Sq Ft
$403/Sq Ft
Est. Value
About This Home
This home is located at 2261 Burrmac Ln, Placerville, CA 95667 and is currently estimated at $665,305, approximately $402 per square foot. 2261 Burrmac Ln is a home located in El Dorado County with nearby schools including Sutter's Mill Elementary School, Gold Trail School, and El Dorado High School.
Ownership History
Date
Name
Owned For
Owner Type
Purchase Details
Closed on
Aug 1, 2019
Sold by
Kiner Catherine
Bought by
Kiner Gregory S and Kiner Catherine A
Current Estimated Value
Purchase Details
Closed on
May 2, 2019
Sold by
Prioriello Family Trust
Bought by
Kiner Catherine
Purchase Details
Closed on
Aug 3, 2011
Sold by
Prioriello Ronald A and Prioriello Deborah A
Bought by
Prioriello Ronald A and Prioriello Deborah A
Purchase Details
Closed on
Sep 1, 1994
Sold by
Mcintosh Ralph W and Mcintosh Ann Marie
Bought by
Prioriello Ronald A and Priorello Deborah A
Home Financials for this Owner
Home Financials are based on the most recent Mortgage that was taken out on this home.
Original Mortgage
$136,000
Interest Rate
5.62%
Create a Home Valuation Report for This Property
The Home Valuation Report is an in-depth analysis detailing your home's value as well as a comparison with similar homes in the area
Home Values in the Area
Average Home Value in this Area
Purchase History
| Date | Buyer | Sale Price | Title Company |
|---|---|---|---|
| Kiner Gregory S | -- | None Available | |
| Kiner Catherine | -- | None Available | |
| Prioriello Ronald A | -- | None Available | |
| Prioriello Ronald A | $186,000 | Placer Title Company |
Source: Public Records
Mortgage History
| Date | Status | Borrower | Loan Amount |
|---|---|---|---|
| Previous Owner | Prioriello Ronald A | $136,000 |
Source: Public Records
Tax History
| Year | Tax Paid | Tax Assessment Tax Assessment Total Assessment is a certain percentage of the fair market value that is determined by local assessors to be the total taxable value of land and additions on the property. | Land | Improvement |
|---|---|---|---|---|
| 2025 | $3,691 | $329,330 | $159,553 | $169,777 |
| 2024 | $3,691 | $322,874 | $156,425 | $166,449 |
| 2023 | $3,622 | $316,544 | $153,358 | $163,186 |
| 2022 | $3,572 | $310,338 | $150,351 | $159,987 |
| 2021 | $3,525 | $304,253 | $147,403 | $156,850 |
| 2020 | $3,495 | $301,134 | $145,892 | $155,242 |
| 2019 | $3,504 | $295,231 | $143,032 | $152,199 |
| 2018 | $3,416 | $289,443 | $140,228 | $149,215 |
| 2017 | $3,347 | $283,769 | $137,479 | $146,290 |
| 2016 | $3,304 | $278,206 | $134,784 | $143,422 |
| 2015 | $3,203 | $274,029 | $132,760 | $141,269 |
| 2014 | $3,203 | $268,662 | $130,160 | $138,502 |
Source: Public Records
Map
Nearby Homes
- 1363 Crooked Mile Ct
- 4740 Glory View Dr
- 5050 Glory View Dr
- 4371 Luneman Rd
- 1110 Trails End Dr
- 4644 Bakers Mountain Rd
- 0 Rossler Rd
- 1700 Shadydale Ln
- 4890 Thompson Hill Rd
- 4950 Thompson Hill Rd
- 5080 Thompson Hill Rd
- 3815 Lakeview Dr
- 994 Lotus Rd
- 5661 Thompson Hill Rd
- 1240 Los Robles Rd
- 710 Cold Springs Rd
- 7162 Amoloc Ln
- 581 Cold Springs Rd
- 6060 Gold Hill Rd
- 6400 State Highway 49
- 2231 Burrmac Ln
- 4590 Stoney Ridge Rd
- 2250 Burrmac Ln
- 4631 Stoney Ridge Rd
- 2230 Burrmac Ln
- 1390 Arrowbee Dr
- 1404 Arrowbee Dr
- 1400 Kathy Annes Ln
- 4544 Stoney Ridge Rd
- 1340 Arrowbee Dr
- 4575 Stoney Ridge Rd
- 1393 Arrowbee Dr
- 4910 Joyous Ann Dr
- 4580 Mewuk Dr
- 1345 Arrowbee Dr
- 4561 Mewuk Dr
- Acres Arrowbee Dr
- 5 Arrowbee Dr
- 1405 Arrowbee Dr
- 1371 Arrowbee Dr
Your Personal Tour Guide
Ask me questions while you tour the home.