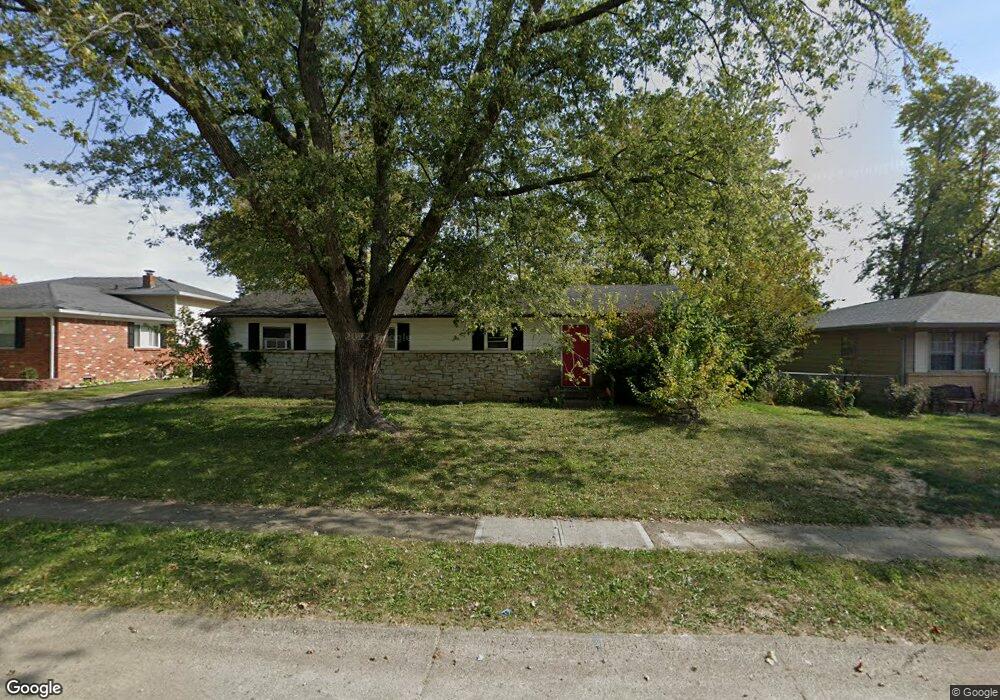
2261 Herod Ct Indianapolis, IN 46229
East Warren NeighborhoodEstimated Value: $161,000 - $203,399
3
Beds
2
Baths
1,648
Sq Ft
$110/Sq Ft
Est. Value
About This Home
This home is located at 2261 Herod Ct, Indianapolis, IN 46229 and is currently estimated at $180,850, approximately $109 per square foot. 2261 Herod Ct is a home located in Marion County with nearby schools including Stonybrook Intermediate Academy (5-6), Brookview Elementary School, and Stonybrook Middle School.
Ownership History
Date
Name
Owned For
Owner Type
Purchase Details
Closed on
Feb 2, 2012
Sold by
Mbp Llc
Bought by
Northridge Investment Group Llc
Current Estimated Value
Purchase Details
Closed on
Aug 5, 2008
Sold by
U S Bank Na
Bought by
Mbp Llc
Purchase Details
Closed on
Jun 12, 2008
Sold by
Howell Becky L
Bought by
Us Bank Na
Purchase Details
Closed on
Oct 26, 2005
Sold by
Axiom Property Investments Llc
Bought by
Howell Becky L
Home Financials for this Owner
Home Financials are based on the most recent Mortgage that was taken out on this home.
Original Mortgage
$84,800
Interest Rate
5.89%
Mortgage Type
New Conventional
Purchase Details
Closed on
Jun 7, 2005
Sold by
Hsbc Bank
Bought by
Axiom Properties Investments Llc
Purchase Details
Closed on
Feb 2, 2005
Sold by
Brewster William E and Brewster Dianne
Bought by
Hsbc Bank Usa
Create a Home Valuation Report for This Property
The Home Valuation Report is an in-depth analysis detailing your home's value as well as a comparison with similar homes in the area
Home Values in the Area
Average Home Value in this Area
Purchase History
| Date | Buyer | Sale Price | Title Company |
|---|---|---|---|
| Northridge Investment Group Llc | -- | None Available | |
| Mbp Llc | -- | None Available | |
| Us Bank Na | $84,150 | None Available | |
| Howell Becky L | -- | None Available | |
| Axiom Properties Investments Llc | -- | None Available | |
| Hsbc Bank Usa | -- | None Available |
Source: Public Records
Mortgage History
| Date | Status | Borrower | Loan Amount |
|---|---|---|---|
| Previous Owner | Howell Becky L | $84,800 |
Source: Public Records
Tax History Compared to Growth
Tax History
| Year | Tax Paid | Tax Assessment Tax Assessment Total Assessment is a certain percentage of the fair market value that is determined by local assessors to be the total taxable value of land and additions on the property. | Land | Improvement |
|---|---|---|---|---|
| 2024 | $3,016 | $152,100 | $22,700 | $129,400 |
| 2023 | $3,016 | $126,500 | $22,700 | $103,800 |
| 2022 | $2,902 | $127,400 | $22,700 | $104,700 |
| 2021 | $2,638 | $115,300 | $22,700 | $92,600 |
| 2020 | $2,207 | $95,700 | $22,700 | $73,000 |
| 2019 | $2,163 | $93,800 | $22,700 | $71,100 |
| 2018 | $2,004 | $86,700 | $22,700 | $64,000 |
| 2017 | $1,814 | $86,100 | $22,700 | $63,400 |
| 2016 | $1,702 | $80,600 | $22,700 | $57,900 |
| 2014 | $1,616 | $80,800 | $21,200 | $59,600 |
| 2013 | $1,750 | $87,500 | $21,200 | $66,300 |
Source: Public Records
Map
Nearby Homes
- 10348 E 25th St
- 10343 E 21st Place
- 10327 Starview Dr
- 10131 Nassau Ln
- 2173 Harvest Moon Dr
- 2631 Pawnee Dr
- 2614 Fairhaven Dr
- 10913 Golden Harvest Place
- 10314 Starhaven Cir
- 10952 Golden Harvest Place
- 2740 Pawnee Dr
- 2046 Schwier Ct
- 1903 Schwier Ct
- 10020 E 25th St
- 2729 Grassy Creek Dr
- 1908 Schwier Ct
- 10064 Penrith Dr
- 10057 Dedham Dr
- 2813 Grassy Creek Dr
- 10004 Penrith Dr