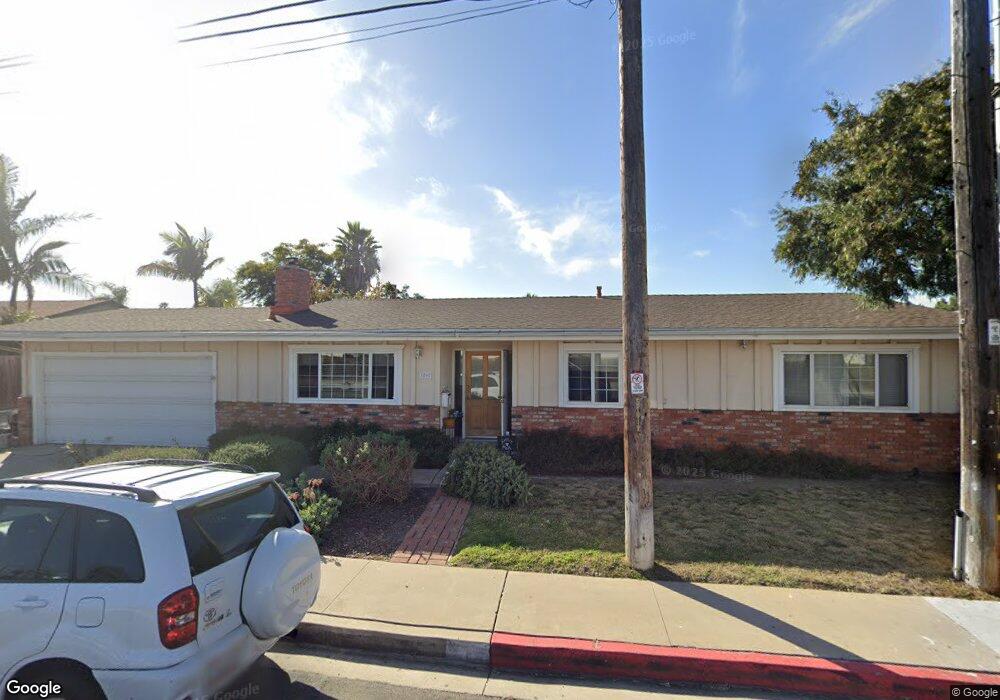
2262 Burgener Blvd San Diego, CA 92110
Bay Park NeighborhoodEstimated Value: $1,240,000 - $1,484,000
4
Beds
2
Baths
1,570
Sq Ft
$887/Sq Ft
Est. Value
About This Home
This home is located at 2262 Burgener Blvd, San Diego, CA 92110 and is currently estimated at $1,391,985, approximately $886 per square foot. 2262 Burgener Blvd is a home located in San Diego County with nearby schools including Bay Park Elementary School, Marston Middle School, and Clairemont High School.
Ownership History
Date
Name
Owned For
Owner Type
Purchase Details
Closed on
Jan 20, 2017
Sold by
Sheeron Jeffery and Sheeron Shawn
Bought by
Sheeron Jeffery C and Sheeron Shawn M
Current Estimated Value
Purchase Details
Closed on
Feb 11, 2011
Sold by
Sheeron Jeffery and Sheeron Jeffrey C
Bought by
Sheeron Jeffery and Sheeron Shawn
Home Financials for this Owner
Home Financials are based on the most recent Mortgage that was taken out on this home.
Original Mortgage
$189,000
Outstanding Balance
$6,961
Interest Rate
4.09%
Mortgage Type
New Conventional
Estimated Equity
$1,385,024
Purchase Details
Closed on
May 13, 1997
Sold by
Swank Betty L
Bought by
Sheeron Jeffery C
Home Financials for this Owner
Home Financials are based on the most recent Mortgage that was taken out on this home.
Original Mortgage
$164,000
Interest Rate
7.98%
Create a Home Valuation Report for This Property
The Home Valuation Report is an in-depth analysis detailing your home's value as well as a comparison with similar homes in the area
Home Values in the Area
Average Home Value in this Area
Purchase History
| Date | Buyer | Sale Price | Title Company |
|---|---|---|---|
| Sheeron Jeffery C | -- | None Available | |
| Sheeron Jeffery | -- | Ticor Title Company Of Ca | |
| Sheeron Jeffery C | $205,000 | Old Republic Title Company |
Source: Public Records
Mortgage History
| Date | Status | Borrower | Loan Amount |
|---|---|---|---|
| Open | Sheeron Jeffery | $189,000 | |
| Closed | Sheeron Jeffery C | $164,000 |
Source: Public Records
Tax History Compared to Growth
Tax History
| Year | Tax Paid | Tax Assessment Tax Assessment Total Assessment is a certain percentage of the fair market value that is determined by local assessors to be the total taxable value of land and additions on the property. | Land | Improvement |
|---|---|---|---|---|
| 2025 | $4,055 | $333,851 | $146,116 | $187,735 |
| 2024 | $4,055 | $327,305 | $143,251 | $184,054 |
| 2023 | $3,965 | $320,889 | $140,443 | $180,446 |
| 2022 | $3,860 | $314,598 | $137,690 | $176,908 |
| 2021 | $3,833 | $308,431 | $134,991 | $173,440 |
| 2020 | $3,787 | $305,269 | $133,607 | $171,662 |
| 2019 | $3,720 | $299,285 | $130,988 | $168,297 |
| 2018 | $3,479 | $293,418 | $128,420 | $164,998 |
| 2017 | $80 | $287,665 | $125,902 | $161,763 |
| 2016 | $3,341 | $282,026 | $123,434 | $158,592 |
| 2015 | $3,292 | $277,790 | $121,580 | $156,210 |
| 2014 | $3,241 | $272,350 | $119,199 | $153,151 |
Source: Public Records
Map
Nearby Homes
- 4993 February St
- 2190 Penrose St
- 4931 Southcrest Ave
- 2261 Garfield Rd
- 4921 September St
- 2628 Grandview St
- 6283 Caminito Del Oeste
- 6338 Caminito Del Pastel Unit 148
- 6340 Caminito Del Pastel Unit 147
- 4960 Sparks Ave
- 2711 Deerpark Dr
- 5011 Gardena Ave
- 4770 Jellett St
- 4821 Viane Way
- 6426 Caminito Listo
- 6422 Caminito Listo
- 1850 Illion St
- 2802 Cowley Way
- 6492 Lanston St
- 4542 Milton St
- 5061 Milton St
- 2252 Burgener Blvd
- 5059 Milton St
- 2242 Burgener Blvd
- 5053 Milton St
- 2232 Burgener Blvd
- 2231 August Ct
- 5047 Milton St
- 2222 Burgener Blvd
- 2232 August Ct
- 2221 August Ct
- 5043 Milton St
- 5040 Milton St
- 2212 Burgener Blvd
- 5041 Milton St
- 2303 Burgener Blvd
- 2211 August Ct
- 5039 Milton St
- 2222 August Ct
- 2304 Burgener Blvd