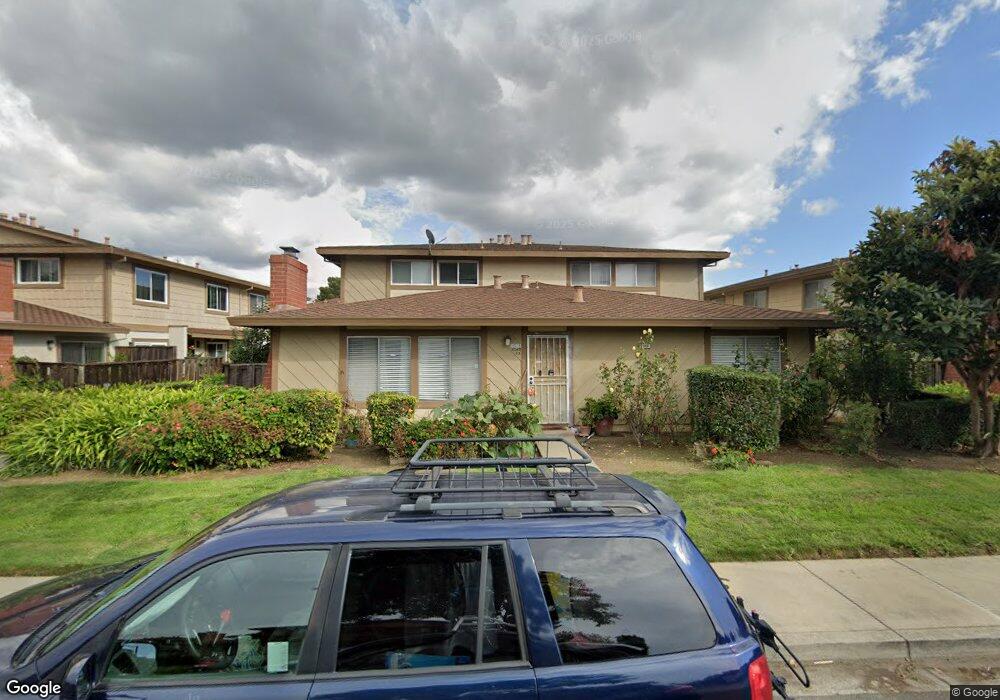
2262 Eric Ct Unit 4 Union City, CA 94587
Estimated Value: $500,000 - $560,666
3
Beds
2
Baths
1,003
Sq Ft
$530/Sq Ft
Est. Value
About This Home
This home is located at 2262 Eric Ct Unit 4, Union City, CA 94587 and is currently estimated at $531,417, approximately $529 per square foot. 2262 Eric Ct Unit 4 is a home located in Alameda County with nearby schools including Tom Kitayama Elementary School, Cesar Chavez Middle School, and James Logan High School.
Ownership History
Date
Name
Owned For
Owner Type
Purchase Details
Closed on
Aug 12, 2014
Sold by
Ko Qiu Xue Feng and Ko Qiu Stephanie Wah Ka
Bought by
Qui Xue Feng and Qui Stephenie R
Current Estimated Value
Purchase Details
Closed on
Jun 20, 2012
Sold by
Chavira Alex C
Bought by
Ko Qiu Xue Feng and Ko Qiu Stephanie Wahka
Purchase Details
Closed on
Jan 17, 2007
Sold by
Chavira Alex C
Bought by
Chavira Alex C
Purchase Details
Closed on
Dec 16, 1999
Sold by
Kennard Gary S and Kennard Cristina M
Bought by
Rayandayan Ronald R and Rayandayan Grace D
Home Financials for this Owner
Home Financials are based on the most recent Mortgage that was taken out on this home.
Original Mortgage
$132,400
Interest Rate
7.82%
Mortgage Type
Stand Alone First
Create a Home Valuation Report for This Property
The Home Valuation Report is an in-depth analysis detailing your home's value as well as a comparison with similar homes in the area
Home Values in the Area
Average Home Value in this Area
Purchase History
| Date | Buyer | Sale Price | Title Company |
|---|---|---|---|
| Qui Xue Feng | -- | None Available | |
| Ko Qiu Xue Feng | $165,000 | Chicago Title Company | |
| Chavira Alex C | -- | None Available | |
| Rayandayan Ronald R | $165,500 | Financial Title Company |
Source: Public Records
Mortgage History
| Date | Status | Borrower | Loan Amount |
|---|---|---|---|
| Previous Owner | Rayandayan Ronald R | $132,400 | |
| Closed | Rayandayan Ronald R | $24,825 |
Source: Public Records
Tax History Compared to Growth
Tax History
| Year | Tax Paid | Tax Assessment Tax Assessment Total Assessment is a certain percentage of the fair market value that is determined by local assessors to be the total taxable value of land and additions on the property. | Land | Improvement |
|---|---|---|---|---|
| 2025 | $3,801 | $203,177 | $60,953 | $142,224 |
| 2024 | $3,801 | $199,194 | $59,758 | $139,436 |
| 2023 | $3,633 | $195,288 | $58,586 | $136,702 |
| 2022 | $3,545 | $191,460 | $57,438 | $134,022 |
| 2021 | $3,469 | $187,707 | $56,312 | $131,395 |
| 2020 | $3,426 | $185,783 | $55,735 | $130,048 |
| 2019 | $3,447 | $182,141 | $54,642 | $127,499 |
| 2018 | $3,364 | $178,570 | $53,571 | $124,999 |
| 2017 | $3,282 | $175,068 | $52,520 | $122,548 |
| 2016 | $3,164 | $171,637 | $51,491 | $120,146 |
| 2015 | $3,101 | $169,060 | $50,718 | $118,342 |
| 2014 | $2,993 | $165,748 | $49,724 | $116,024 |
Source: Public Records
Map
Nearby Homes
- 32625 Brenda Way Unit 1
- 167 Kona Cir
- 2469 Ascot Way
- 3501 Lake Ontario Dr
- 33010 Lake Mead Dr
- 192 Hawaii Cir
- 2716 Killdeer Ct
- 259 Molokai Cir Unit 259
- 328 Waikiki Cir
- 23 Palm Dr
- 30 Palm Dr Unit 30
- 31274 Santa Maria Dr
- 3178 Santa Marta Ct
- 32333 Crest Ln
- 5375 Singh Cir
- 5325 Singh Cir
- 32613 Singh Cir
- 32542 Lake Tana St
- 33228 Jamie Cir
- 2544 Franklin Ave Unit 172
- 2262 Eric Ct Unit 1
- 2262 Eric Ct Unit 3
- 2262 Eric Ct Unit 2
- 2274 Eric Ct Unit 1
- 2274 Eric Ct Unit 3
- 2274 Eric Ct Unit 4
- 2274 Eric Ct
- 2274 Eric Ct Unit 2
- 2250 Eric Ct Unit 3
- 2250 Eric Ct
- 2250 Eric Ct Unit 1
- 2250 Eric Ct Unit 4
- 2250 Eric Ct Unit 2
- 2233 Medallion Dr Unit 4
- 2233 Medallion Dr
- 2233 Medallion Dr
- 2233 Medallion Dr Unit 2
- 2238 Eric Ct Unit 1
- 2238 Eric Ct
- 2238 Eric Ct Unit 2