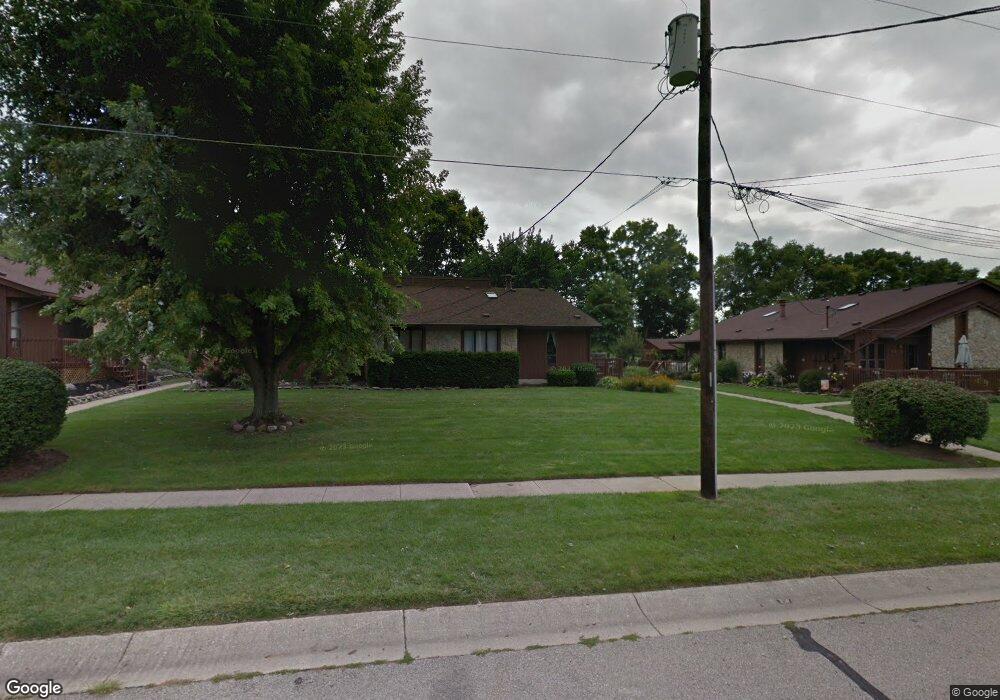
2262 Joshua Cir Middletown, OH 45044
Turtlecreek Township NeighborhoodEstimated Value: $151,381 - $227,000
2
Beds
2
Baths
1,289
Sq Ft
$137/Sq Ft
Est. Value
About This Home
This home is located at 2262 Joshua Cir, Middletown, OH 45044 and is currently estimated at $176,845, approximately $137 per square foot. 2262 Joshua Cir is a home located in Warren County with nearby schools including Bowman Primary School, Berry Intermediate School, and Donovan Elementary School.
Ownership History
Date
Name
Owned For
Owner Type
Purchase Details
Closed on
Jun 23, 2006
Sold by
Sorrell Kimberly S
Bought by
Sorrell Kimberly S
Current Estimated Value
Home Financials for this Owner
Home Financials are based on the most recent Mortgage that was taken out on this home.
Original Mortgage
$71,364
Outstanding Balance
$42,331
Interest Rate
6.73%
Mortgage Type
FHA
Estimated Equity
$134,514
Purchase Details
Closed on
Jul 10, 2001
Sold by
Fourman Scott
Bought by
Sorrell Kimberly
Home Financials for this Owner
Home Financials are based on the most recent Mortgage that was taken out on this home.
Original Mortgage
$73,873
Interest Rate
7.2%
Mortgage Type
FHA
Purchase Details
Closed on
Mar 19, 1991
Sold by
Williamson Genevieve M and Williamson Genevieve M
Bought by
Fourman and Fourman Scott C
Purchase Details
Closed on
Mar 25, 1986
Sold by
Lewis Co
Bought by
Williamson Williamson and Williamson Genevieve M
Purchase Details
Closed on
Feb 21, 1986
Sold by
Lewis Company
Bought by
Lewis Co
Create a Home Valuation Report for This Property
The Home Valuation Report is an in-depth analysis detailing your home's value as well as a comparison with similar homes in the area
Home Values in the Area
Average Home Value in this Area
Purchase History
| Date | Buyer | Sale Price | Title Company |
|---|---|---|---|
| Sorrell Kimberly S | -- | None Available | |
| Sorrell Kimberly | $76,000 | -- | |
| Fourman | $54,900 | -- | |
| Williamson Williamson | $49,500 | -- | |
| Lewis Co | -- | -- |
Source: Public Records
Mortgage History
| Date | Status | Borrower | Loan Amount |
|---|---|---|---|
| Open | Sorrell Kimberly S | $71,364 | |
| Closed | Sorrell Kimberly | $73,873 |
Source: Public Records
Tax History Compared to Growth
Tax History
| Year | Tax Paid | Tax Assessment Tax Assessment Total Assessment is a certain percentage of the fair market value that is determined by local assessors to be the total taxable value of land and additions on the property. | Land | Improvement |
|---|---|---|---|---|
| 2024 | $1,452 | $36,300 | $3,500 | $32,800 |
| 2023 | $1,358 | $30,646 | $3,955 | $26,691 |
| 2022 | $1,371 | $30,646 | $3,955 | $26,691 |
| 2021 | $1,272 | $30,646 | $3,955 | $26,691 |
| 2020 | $1,350 | $27,122 | $3,500 | $23,622 |
| 2019 | $1,358 | $27,122 | $3,500 | $23,622 |
| 2018 | $1,223 | $27,122 | $3,500 | $23,622 |
| 2017 | $1,189 | $23,534 | $2,758 | $20,776 |
| 2016 | $1,229 | $23,534 | $2,758 | $20,776 |
| 2015 | $1,239 | $23,534 | $2,758 | $20,776 |
| 2014 | $1,286 | $23,530 | $2,760 | $20,780 |
| 2013 | $1,288 | $29,850 | $3,500 | $26,350 |
Source: Public Records
Map
Nearby Homes
- 6679 Hendrickson Rd
- 6710 Hendrickson Rd
- 6640 Baybrook Ct
- Lot 3 Greentree Rd
- 2571 Vinny Dr
- 6870 Anthony Ct
- Lot 1 Greentree Rd
- 0 Greentree Rd Unit 934072
- Lot 2 Greentree Rd
- 6843 Traditions St
- 6843 Traditions St Unit 27
- 6841 Traditions St Unit 26
- 6841 Traditions St
- 6842 Traditions St Unit 41
- 6842 Traditions St
- 6839 Traditions St
- 6839 Traditions St Unit 25
- 6840 Traditions St
- 6840 Traditions St Unit 42
- 6837 Traditions St Unit 24
- 2264 Joshua Cir Unit 47
- 2266 Joshua Cir
- 2260 Joshua Cir
- 2280 Joshua Cir Unit 49
- 2256 Joshua Cir
- 2254 Joshua Cir
- 2250 Joshua Cir
- 2252 Joshua Cir Unit 36
- 2281 Joshua Cir
- 2300 Joshua Cir
- 2267 Joshua Cir
- 2265 Joshua Cir
- 2236 Joshua Cir
- 2234 Joshua Cir
- 2253 Joshua Cir
- 2302 Joshua Cir
- 2251 Joshua Cir
- 2251 Joshua Cir
- 2230 Joshua Cir Unit 31
- 2232 Joshua Cir