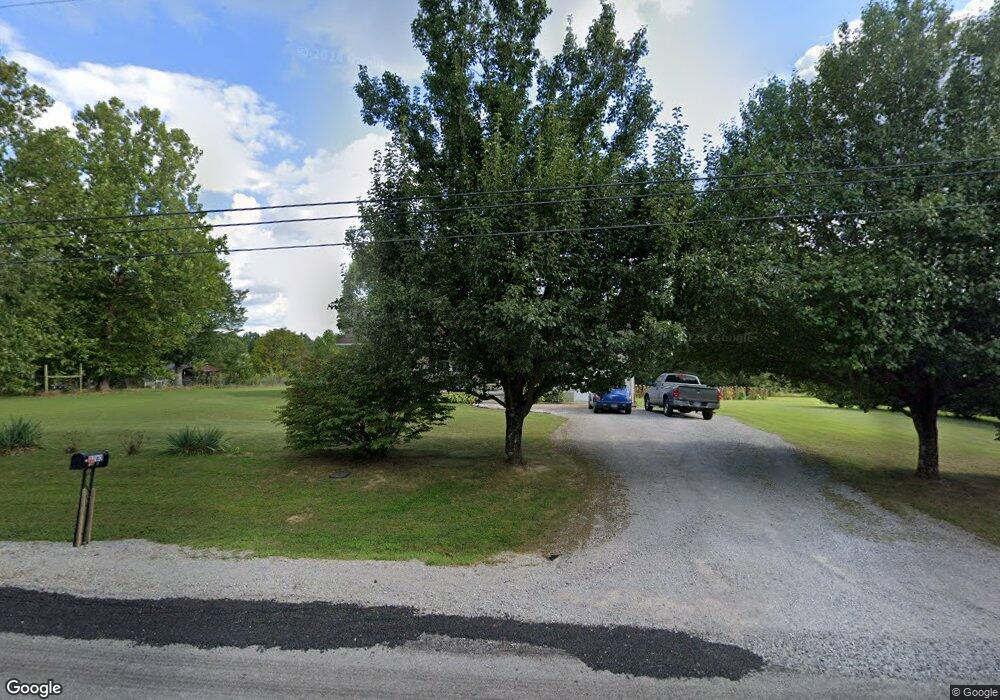
2263 Bell Rd Crossville, TN 38571
Estimated Value: $224,047 - $274,000
--
Bed
2
Baths
1,232
Sq Ft
$207/Sq Ft
Est. Value
About This Home
This home is located at 2263 Bell Rd, Crossville, TN 38571 and is currently estimated at $255,262, approximately $207 per square foot. 2263 Bell Rd is a home located in Cumberland County with nearby schools including Pleasant Hill Elementary School, Cumberland County High School, and Inez Wrenn SDA School.
Ownership History
Date
Name
Owned For
Owner Type
Purchase Details
Closed on
Nov 6, 2007
Sold by
Kleinsmith Philip M
Bought by
Farren Robert R
Current Estimated Value
Purchase Details
Closed on
Jun 18, 2002
Sold by
Deck Mitchell and Deck Teresa
Bought by
Garrett Charles
Home Financials for this Owner
Home Financials are based on the most recent Mortgage that was taken out on this home.
Original Mortgage
$71,100
Interest Rate
6.86%
Purchase Details
Closed on
Sep 17, 1998
Sold by
Freeman Willie Roscoe
Bought by
Deck Mitchell L
Home Financials for this Owner
Home Financials are based on the most recent Mortgage that was taken out on this home.
Original Mortgage
$6,805
Interest Rate
6.92%
Purchase Details
Closed on
Jul 10, 1995
Sold by
Freeman Willie Roscoe
Bought by
Sidwell Delane
Create a Home Valuation Report for This Property
The Home Valuation Report is an in-depth analysis detailing your home's value as well as a comparison with similar homes in the area
Home Values in the Area
Average Home Value in this Area
Purchase History
| Date | Buyer | Sale Price | Title Company |
|---|---|---|---|
| Farren Robert R | $76,000 | -- | |
| Garrett Charles | $79,000 | -- | |
| Deck Mitchell L | $6,250 | -- | |
| Sidwell Delane | -- | -- |
Source: Public Records
Mortgage History
| Date | Status | Borrower | Loan Amount |
|---|---|---|---|
| Previous Owner | Sidwell Delane | $71,100 | |
| Previous Owner | Sidwell Delane | $6,805 |
Source: Public Records
Tax History Compared to Growth
Tax History
| Year | Tax Paid | Tax Assessment Tax Assessment Total Assessment is a certain percentage of the fair market value that is determined by local assessors to be the total taxable value of land and additions on the property. | Land | Improvement |
|---|---|---|---|---|
| 2025 | $412 | $36,325 | $1,700 | $34,625 |
| 2024 | $412 | $36,325 | $1,700 | $34,625 |
| 2023 | $412 | $36,325 | $0 | $0 |
| 2022 | $412 | $36,325 | $1,700 | $34,625 |
| 2021 | $338 | $21,600 | $1,425 | $20,175 |
| 2020 | $338 | $21,600 | $1,425 | $20,175 |
| 2019 | $338 | $21,600 | $1,425 | $20,175 |
| 2018 | $338 | $21,600 | $1,425 | $20,175 |
| 2017 | $338 | $21,600 | $1,425 | $20,175 |
| 2016 | $324 | $21,225 | $1,425 | $19,800 |
| 2015 | $318 | $21,225 | $1,425 | $19,800 |
| 2014 | $318 | $21,214 | $0 | $0 |
Source: Public Records
Map
Nearby Homes
- 6419 Highway 70 N
- 1215 Pomona Rd
- 323 Noah Ln
- 104 Lakyn Dr
- 871 Pomona Rd
- 5.76 Pomona Rd
- 0 Hwy 70 N Unit 1317197
- 0 Bell Rd
- 1447 Dykes Rd
- 458 Pomona Rd
- 281 Red Williams Rd
- 181 Pomona Rd
- 37 Windy Acres Dr
- 0 Creek Ridge Cove Unit RTC2493017
- 0 Creek Ridge Cove Unit RTC2492982
- 0 Old Tanner Cemetery Rd Unit 239306
- 0 Old Tanner Cemetery Rd Unit 239305
- 0 Old Tanner Cemetery Rd Unit 239308
- 614 W Creston Rd
- 0