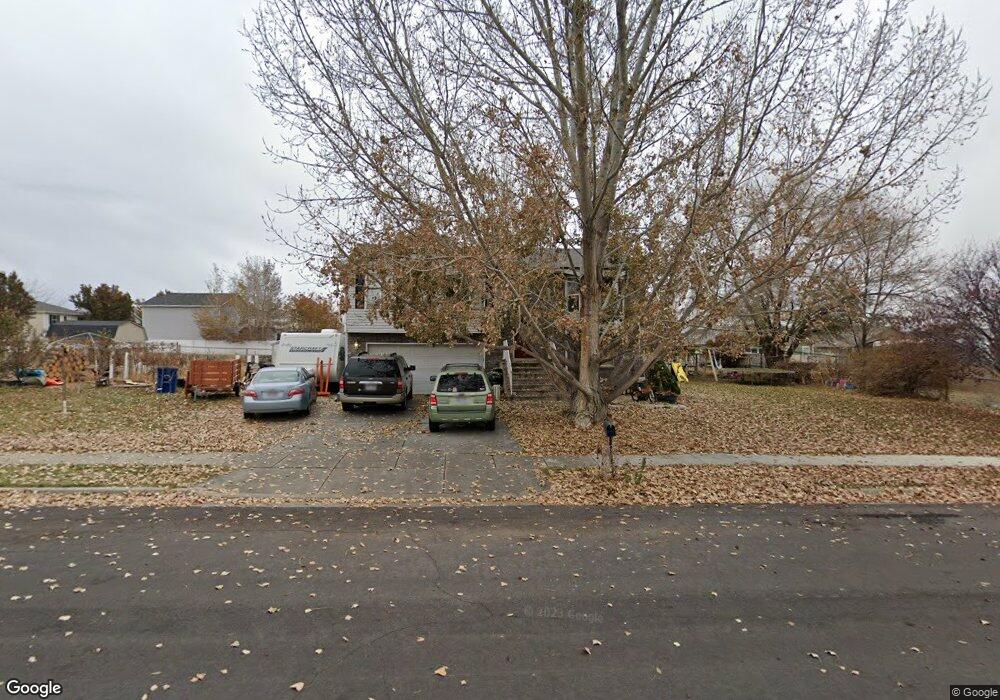
2263 W 2075 N Clearfield, UT 84015
Estimated Value: $427,000 - $441,000
3
Beds
2
Baths
1,686
Sq Ft
$257/Sq Ft
Est. Value
About This Home
This home is located at 2263 W 2075 N, Clearfield, UT 84015 and is currently estimated at $433,390, approximately $257 per square foot. 2263 W 2075 N is a home located in Davis County with nearby schools including West Clinton Elementary School, West Point Junior High School, and Clearfield High School.
Ownership History
Date
Name
Owned For
Owner Type
Purchase Details
Closed on
Mar 1, 2004
Sold by
Clark Jeff S
Bought by
Misrasi Samuel T
Current Estimated Value
Home Financials for this Owner
Home Financials are based on the most recent Mortgage that was taken out on this home.
Original Mortgage
$122,478
Outstanding Balance
$56,603
Interest Rate
5.62%
Mortgage Type
FHA
Estimated Equity
$376,787
Purchase Details
Closed on
Dec 2, 2003
Sold by
Burton Sherry A and Burton Christopher E
Bought by
Clark Jeff S
Purchase Details
Closed on
Jul 29, 2002
Sold by
Burton Sherry A
Bought by
Burton Christopher E
Purchase Details
Closed on
Nov 18, 1997
Sold by
Tierra Management Llc
Bought by
Hamilton Development Llc
Purchase Details
Closed on
Apr 14, 1997
Sold by
Tierra Management Llc
Bought by
Burton Christopher E and Burton Sherry A
Home Financials for this Owner
Home Financials are based on the most recent Mortgage that was taken out on this home.
Original Mortgage
$88,000
Interest Rate
7.86%
Create a Home Valuation Report for This Property
The Home Valuation Report is an in-depth analysis detailing your home's value as well as a comparison with similar homes in the area
Home Values in the Area
Average Home Value in this Area
Purchase History
| Date | Buyer | Sale Price | Title Company |
|---|---|---|---|
| Misrasi Samuel T | -- | Inwest Title Services Inc | |
| Clark Jeff S | $104,436 | -- | |
| Burton Christopher E | -- | Mountain View Title & Escrow | |
| Hamilton Development Llc | -- | -- | |
| Burton Christopher E | -- | First American Title Co |
Source: Public Records
Mortgage History
| Date | Status | Borrower | Loan Amount |
|---|---|---|---|
| Open | Misrasi Samuel T | $122,478 | |
| Previous Owner | Burton Christopher E | $88,000 | |
| Closed | Burton Christopher E | $1,400 |
Source: Public Records
Tax History Compared to Growth
Tax History
| Year | Tax Paid | Tax Assessment Tax Assessment Total Assessment is a certain percentage of the fair market value that is determined by local assessors to be the total taxable value of land and additions on the property. | Land | Improvement |
|---|---|---|---|---|
| 2025 | $2,271 | $218,350 | $97,411 | $120,939 |
| 2024 | $2,179 | $210,650 | $106,324 | $104,326 |
| 2023 | $2,002 | $358,000 | $121,685 | $236,315 |
| 2022 | $2,151 | $212,850 | $72,938 | $139,912 |
| 2021 | $1,949 | $286,000 | $93,850 | $192,150 |
| 2020 | $1,687 | $245,000 | $81,120 | $163,880 |
| 2019 | $1,621 | $230,000 | $92,260 | $137,740 |
| 2018 | $1,463 | $204,000 | $77,024 | $126,976 |
| 2016 | $1,375 | $99,000 | $30,501 | $68,499 |
| 2015 | $1,349 | $92,345 | $30,501 | $61,844 |
| 2014 | $1,367 | $95,057 | $30,501 | $64,556 |
| 2013 | -- | $88,284 | $27,143 | $61,141 |
Source: Public Records
Map
Nearby Homes
- 2162 N 2290 W
- 2616 N 2125 W Unit 147
- 2034 N 2095 W
- 2434 W 2250 N
- Harvard Plan at Summerfield - Enclave
- 2208 W 2615 N
- Linden Plan at Summerfield - Vista
- Yale Plan at Summerfield - Enclave
- Gambel Oak Plan at Summerfield - Vista
- Cedar Plan at Summerfield - Vista
- Elm Plan at Summerfield - Vista
- Princeton Plan at Summerfield - Enclave
- Cambridge Plan at Summerfield - Enclave
- Cornell Plan at Summerfield - Enclave
- Sycamore Plan at Summerfield - Vista
- Berkeley Plan at Summerfield - Enclave
- Birch Plan at Summerfield - Vista
- Stanford Plan at Summerfield - Enclave
- 2318 N 2100 W
- 2219 N 2475 W
- 2239 W 2075 N
- 2264 W 2075 N
- 2293 W 2075 N
- 2033 N 2225 W
- 2081 N 2225 W
- 2252 W 2000 N Unit 404
- 1998 N 2250 W
- 2096 N 2290 W
- 2021 N 2225 W
- 2292 W 2075 N
- 2292 W 2075 N Unit 3
- 2286 W 2000 N Unit 405
- 2219 W 2075 N Unit 29
- 2093 N 2225 W
- 2036 N 2225 W
- 2321 W 2075 N
- 2108 N 2290 W
- 2302 W 2000 N
- 2022 N 2225 W
- 2314 W 2075 N