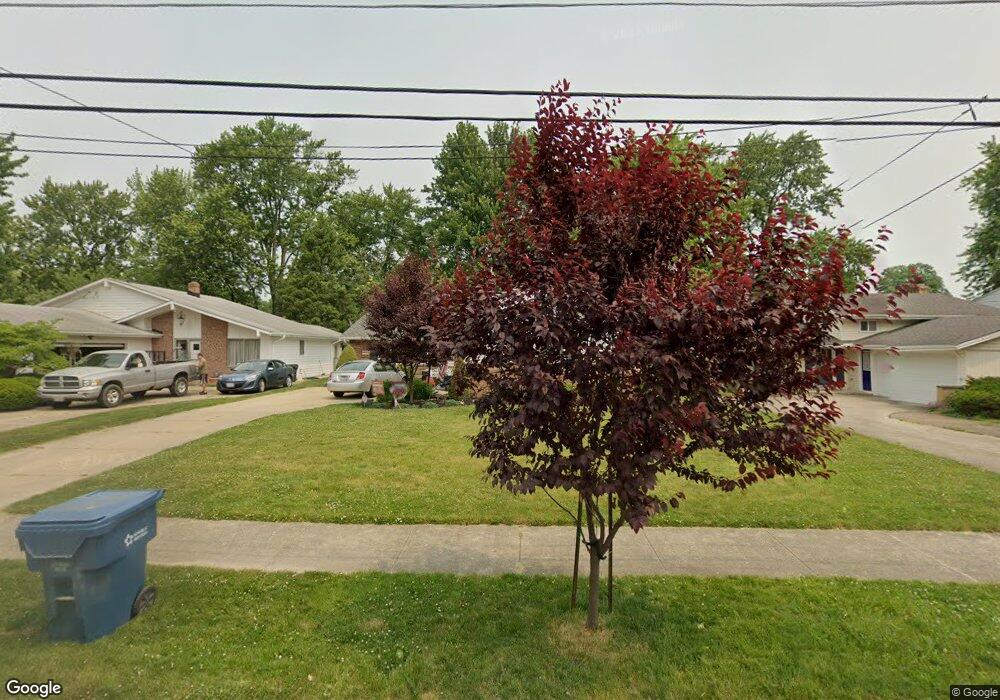
22630 Bard Ave Cleveland, OH 44126
Estimated Value: $315,000 - $355,000
3
Beds
2
Baths
2,119
Sq Ft
$159/Sq Ft
Est. Value
About This Home
This home is located at 22630 Bard Ave, Cleveland, OH 44126 and is currently estimated at $335,962, approximately $158 per square foot. 22630 Bard Ave is a home located in Cuyahoga County with nearby schools including Gilles-Sweet Elementary School, Lewis F Mayer Middle School, and Fairview High School.
Ownership History
Date
Name
Owned For
Owner Type
Purchase Details
Closed on
Jun 26, 1999
Sold by
Rose Mark N and Rose Donna M
Bought by
Akel George and Dobrentey Carol A
Current Estimated Value
Home Financials for this Owner
Home Financials are based on the most recent Mortgage that was taken out on this home.
Original Mortgage
$108,000
Outstanding Balance
$29,273
Interest Rate
7.15%
Estimated Equity
$306,689
Purchase Details
Closed on
Apr 29, 1996
Sold by
Ackerman Janet G
Bought by
Rose Mark N and Rose Donna M
Home Financials for this Owner
Home Financials are based on the most recent Mortgage that was taken out on this home.
Original Mortgage
$121,500
Interest Rate
7.91%
Mortgage Type
New Conventional
Purchase Details
Closed on
Jun 30, 1978
Sold by
Davidson Jackson R
Bought by
Ackerman Janet G
Purchase Details
Closed on
Jun 6, 1977
Sold by
Davidson Jackson R and Davidson Marie
Bought by
Davidson Jackson R
Purchase Details
Closed on
Jan 1, 1975
Bought by
Davidson Jackson R and Davidson Marie
Create a Home Valuation Report for This Property
The Home Valuation Report is an in-depth analysis detailing your home's value as well as a comparison with similar homes in the area
Home Values in the Area
Average Home Value in this Area
Purchase History
| Date | Buyer | Sale Price | Title Company |
|---|---|---|---|
| Akel George | $135,000 | -- | |
| Rose Mark N | $127,900 | -- | |
| Ackerman Janet G | $61,000 | -- | |
| Davidson Jackson R | -- | -- | |
| Davidson Jackson R | -- | -- |
Source: Public Records
Mortgage History
| Date | Status | Borrower | Loan Amount |
|---|---|---|---|
| Open | Akel George | $108,000 | |
| Closed | Rose Mark N | $121,500 | |
| Closed | Akel George | $12,000 |
Source: Public Records
Tax History Compared to Growth
Tax History
| Year | Tax Paid | Tax Assessment Tax Assessment Total Assessment is a certain percentage of the fair market value that is determined by local assessors to be the total taxable value of land and additions on the property. | Land | Improvement |
|---|---|---|---|---|
| 2024 | $7,392 | $108,115 | $17,570 | $90,545 |
| 2023 | $5,948 | $74,140 | $14,880 | $59,260 |
| 2022 | $5,799 | $74,130 | $14,880 | $59,260 |
| 2021 | $5,927 | $74,130 | $14,880 | $59,260 |
| 2020 | $5,426 | $59,500 | $12,010 | $47,500 |
| 2019 | $4,823 | $170,000 | $34,300 | $135,700 |
| 2018 | $4,830 | $59,500 | $12,010 | $47,500 |
| 2017 | $4,646 | $52,960 | $11,200 | $41,760 |
| 2016 | $4,614 | $52,960 | $11,200 | $41,760 |
| 2015 | $4,441 | $52,960 | $11,200 | $41,760 |
| 2014 | $4,441 | $51,420 | $10,890 | $40,530 |
Source: Public Records
Map
Nearby Homes
- 22534 Bard Ave
- 22503 Sandy Ln
- 22506 Sharon Ln
- 22247 Mastick Rd
- 22934 Mastick Rd Unit 102
- 4514 Orchard Rd
- 4464 W 224th St
- 22045 Morton Ave
- 4590 Brendan Ln
- 4627 W 223rd St
- 5951 Rockport Ln
- 22895 Mastick Rd
- 22968 Maple Ridge Rd Unit 103
- 4666 Brendan Cir
- 22976 Maple Ridge Rd Unit B 105
- 4505 Oak Cir
- 22958 Maple Ridge Rd Unit 101A
- 22958 Maple Ridge Rd Unit 202
- 22958 Maple Ridge Rd Unit 209B
- 3463 Clague Rd
- 22646 Bard Ave
- 22662 Bard Ave
- 22598 Bard Ave
- 22621 Macbeth Ave
- 22637 Macbeth Ave
- 22582 Bard Ave
- 22688 Bard Ave
- 22625 Bard Ave
- 22653 Macbeth Ave
- 22645 Bard Ave
- 22615 Bard Ave
- 22589 Macbeth Ave
- 22669 Macbeth Ave
- 22665 Bard Ave
- 22595 Bard Ave
- 22573 Macbeth Ave
- 22566 Bard Ave
- 22685 Macbeth Ave
- 22585 Bard Ave
- 22685 Bard Ave