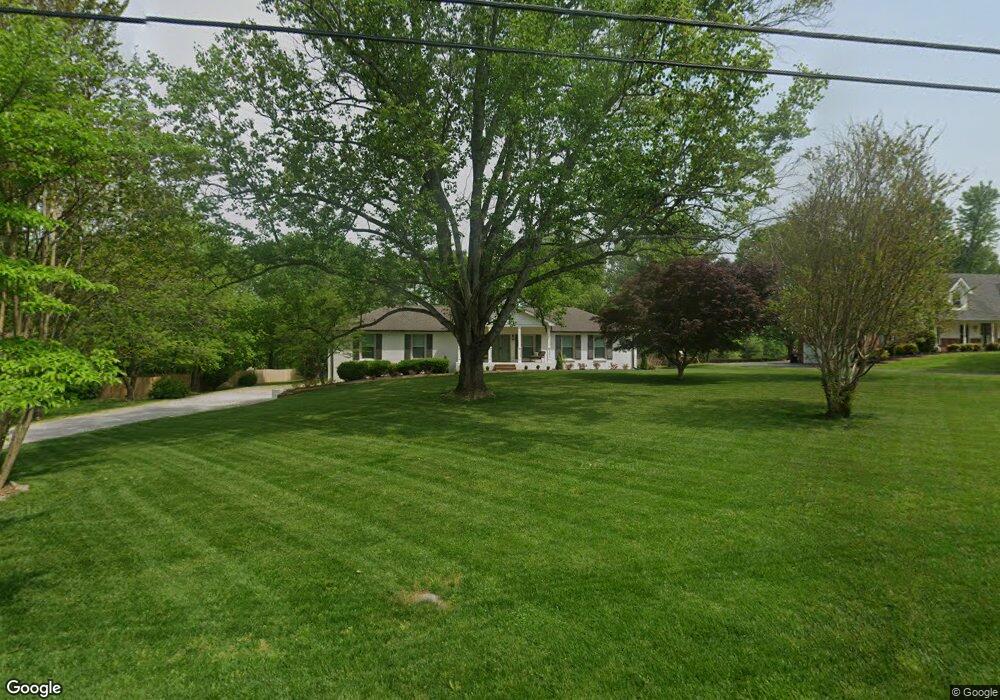
2264 Henpeck Ln Franklin, TN 37064
Goose Creek NeighborhoodEstimated Value: $783,551 - $979,000
--
Bed
3
Baths
2,618
Sq Ft
$331/Sq Ft
Est. Value
About This Home
This home is located at 2264 Henpeck Ln, Franklin, TN 37064 and is currently estimated at $865,388, approximately $330 per square foot. 2264 Henpeck Ln is a home located in Williamson County with nearby schools including Winstead Elementary School, Legacy Middle School, and Montessori School Of Franklin.
Ownership History
Date
Name
Owned For
Owner Type
Purchase Details
Closed on
Jul 29, 2025
Sold by
Sims John S and Sims Darlene
Bought by
Sims Tennessee Community Property Trust
Current Estimated Value
Purchase Details
Closed on
Jul 23, 2002
Sold by
Cendant Mobility Financial Corp
Bought by
Sims John S and Sims Darlene
Home Financials for this Owner
Home Financials are based on the most recent Mortgage that was taken out on this home.
Original Mortgage
$238,960
Interest Rate
6.62%
Mortgage Type
VA
Purchase Details
Closed on
Jun 10, 2002
Sold by
Wachob Frederick L and Wachob Charlene G
Bought by
Cendant Mobility Financial Corp
Home Financials for this Owner
Home Financials are based on the most recent Mortgage that was taken out on this home.
Original Mortgage
$238,960
Interest Rate
6.62%
Mortgage Type
VA
Purchase Details
Closed on
May 31, 1995
Bought by
Wachob Frederick L
Create a Home Valuation Report for This Property
The Home Valuation Report is an in-depth analysis detailing your home's value as well as a comparison with similar homes in the area
Home Values in the Area
Average Home Value in this Area
Purchase History
| Date | Buyer | Sale Price | Title Company |
|---|---|---|---|
| Sims Tennessee Community Property Trust | -- | None Listed On Document | |
| Sims John S | $232,000 | Mid South Title Agency Inc | |
| Cendant Mobility Financial Corp | $232,000 | -- | |
| Wachob Frederick L | $157,900 | -- |
Source: Public Records
Mortgage History
| Date | Status | Borrower | Loan Amount |
|---|---|---|---|
| Previous Owner | Sims John S | $238,960 |
Source: Public Records
Tax History Compared to Growth
Tax History
| Year | Tax Paid | Tax Assessment Tax Assessment Total Assessment is a certain percentage of the fair market value that is determined by local assessors to be the total taxable value of land and additions on the property. | Land | Improvement |
|---|---|---|---|---|
| 2025 | $2,353 | $217,075 | $57,500 | $159,575 |
| 2024 | $2,353 | $125,150 | $32,500 | $92,650 |
| 2023 | $2,353 | $125,150 | $32,500 | $92,650 |
| 2022 | $2,353 | $125,150 | $32,500 | $92,650 |
| 2021 | $2,353 | $125,150 | $32,500 | $92,650 |
| 2020 | $2,244 | $101,075 | $23,750 | $77,325 |
| 2019 | $2,244 | $101,075 | $23,750 | $77,325 |
| 2018 | $2,173 | $101,075 | $23,750 | $77,325 |
| 2017 | $2,173 | $101,075 | $23,750 | $77,325 |
| 2016 | $2,173 | $101,075 | $23,750 | $77,325 |
| 2015 | -- | $78,250 | $23,750 | $54,500 |
| 2014 | -- | $78,250 | $23,750 | $54,500 |
Source: Public Records
Map
Nearby Homes
- 2207 Oakwood Ct
- 2234 Isaac Ln
- 2215 Creekside Ln
- 256 Wisteria Dr
- 298 Wisteria Dr
- 2449 Durham Manor Dr
- 208 Camellia Ct
- 100 Buttercup Cove
- 171 Bluebell Way
- 205 Saint Anne Way
- 269 Stonehaven Cir
- 317 Dundee Dr
- 416 Mackenzie Way
- 1446 Kittrell Rd
- 1358 Hunter Rd
- 728 Braemere Dr
- 2569 Winder Dr
- 1801 Shadow Green Dr Unit 306
- 1801 Shadow Green Dr Unit 104
- 2268 Winder Cir
- 2260 Henpeck Ln
- 2268 Henpeck Ln
- 2256 Henpeck Ln
- 2272 Henpeck Ln
- 2259 Henpeck Ln
- 2255 Henpeck Ln
- 2205 Oakwood Ct
- 2252 Henpeck Ln
- 2276 Henpeck Ln
- 2209 Oakbranch Cir
- 2207 Oakbranch Cir
- 2211 Oakbranch Cir
- 2203 Oakwood Ct
- 2267 Henpeck Ln
- 2248 Henpeck Ln
- 2213 Oakbranch Cir
- 2280 Henpeck Ln
- 2247 Henpeck Ln
- 2215 Oakbranch Cir
- 2202 Oakwood Ct