Estimated Value: $438,000 - $679,000
4
Beds
4
Baths
1,668
Sq Ft
$338/Sq Ft
Est. Value
About This Home
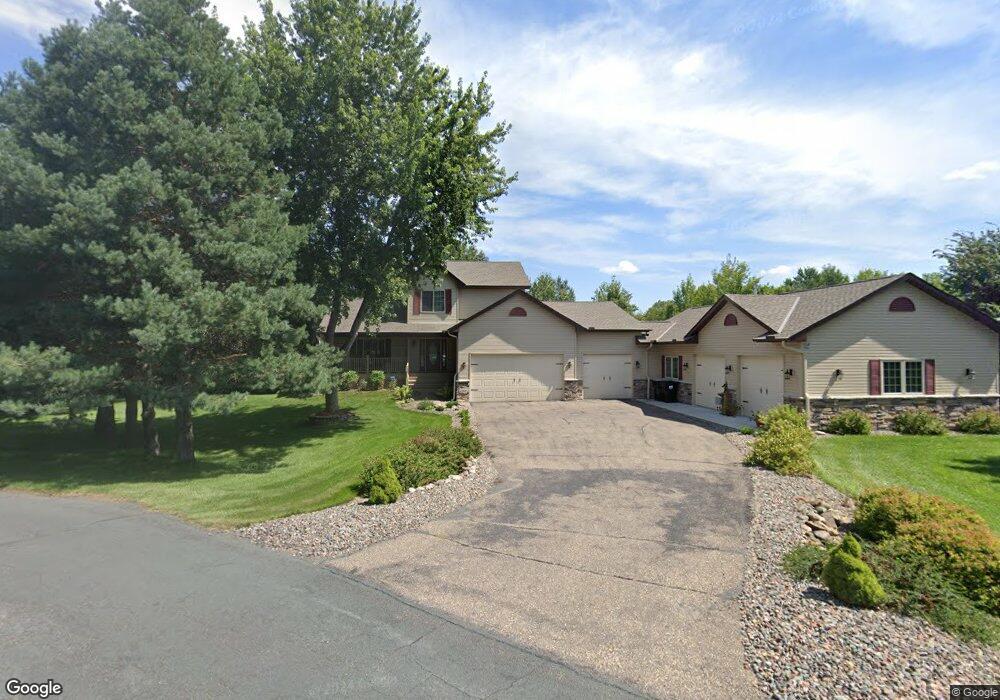
This home is located at 22641 7th St NE, Cedar, MN 55011 and is currently estimated at $564,450, approximately $338 per square foot. 22641 7th St NE is a home located in Anoka County with nearby schools including East Bethel Community School, St. Francis Middle School, and St. Francis High School.
Ownership History
Date
Name
Owned For
Owner Type
Purchase Details
Closed on
May 12, 2020
Sold by
Butler Lori L
Bought by
Butler Lori L and Greene Robin
Current Estimated Value
Purchase Details
Closed on
Jan 31, 2019
Sold by
Beaufeaux Timothy and Beaufeaux Evann M
Bought by
Butler Lori L
Home Financials for this Owner
Home Financials are based on the most recent Mortgage that was taken out on this home.
Original Mortgage
$180,000
Outstanding Balance
$158,252
Interest Rate
4.5%
Mortgage Type
New Conventional
Estimated Equity
$406,198
Purchase Details
Closed on
Feb 3, 2000
Sold by
Triggs Howard W and Triggs Janice L
Bought by
Monarch Homes Inc
Purchase Details
Closed on
Jan 17, 2000
Sold by
Monarch Homes Inc
Bought by
Beaufeaux Timothy G and Beaufeaux Evann M
Create a Home Valuation Report for This Property
The Home Valuation Report is an in-depth analysis detailing your home's value as well as a comparison with similar homes in the area
Home Values in the Area
Average Home Value in this Area
Purchase History
| Date | Buyer | Sale Price | Title Company |
|---|---|---|---|
| Butler Lori L | -- | Executive Title | |
| Butler Lori L | $329,900 | Titlesmart Inc | |
| Monarch Homes Inc | $39,900 | -- | |
| Beaufeaux Timothy G | $205,619 | -- |
Source: Public Records
Mortgage History
| Date | Status | Borrower | Loan Amount |
|---|---|---|---|
| Open | Butler Lori L | $180,000 |
Source: Public Records
Tax History
| Year | Tax Paid | Tax Assessment Tax Assessment Total Assessment is a certain percentage of the fair market value that is determined by local assessors to be the total taxable value of land and additions on the property. | Land | Improvement |
|---|---|---|---|---|
| 2025 | $4,531 | $540,400 | $137,500 | $402,900 |
| 2024 | $4,531 | $517,600 | $112,600 | $405,000 |
| 2023 | $3,697 | $454,000 | $110,600 | $343,400 |
| 2022 | $3,482 | $449,300 | $100,800 | $348,500 |
| 2021 | $3,530 | $364,900 | $87,500 | $277,400 |
| 2020 | $3,825 | $342,800 | $77,500 | $265,300 |
| 2019 | $3,324 | $350,600 | $64,100 | $286,500 |
| 2018 | $3,373 | $290,000 | $0 | $0 |
| 2017 | $3,103 | $286,000 | $0 | $0 |
| 2016 | $3,188 | $247,000 | $0 | $0 |
| 2015 | -- | $247,000 | $55,800 | $191,200 |
| 2014 | -- | $206,500 | $44,000 | $162,500 |
Source: Public Records
Map
Nearby Homes
- 1 221st Ave NW
- 24148 Taylor St NE
- 000 Ulysses St NE
- 21349 Cottonwood St NW
- 21609 Evergreen St NW
- 21532 Butternut St NW
- 21477 Cottonwood St NW
- 21423 Cottonwood St NW
- 000 Unity St NW
- 23566 Ulysses St NE
- 23592 Ulysses St NE
- 40 Main St
- 24188 Polk St NE
- 24161 Polk St NE
- 21346 Cottonwood St NW
- 23588 Baltimore St NE
- 1742 221st Ave NE
- xxxxx Johnson St NE
- 24135 Polk St NE
- 24111 Taylor St NE
- 22656 7th St NE
- 22612 7th St NE
- 22601 7th St NE
- 22636 Washington Ct NE
- 409 226th Ave NE
- 22572 7th St NE
- 22641 Washington Ct NE
- 22584 Washington Ct NE
- (Lot 15) Washington Ct NE
- (Lot 12) Washington Ct NE
- 22543 7th St NE
- 22617 Washington Ct NE
- 22536 7th St NE
- 412 226th Ave NE
- 22583 Washington Ct NE
- 22713 3rd St NE
- 22515 7th St NE
- 446 226th Ave NE
- 22743 3rd St NE
- 592 226th Ave NE
Your Personal Tour Guide
Ask me questions while you tour the home.