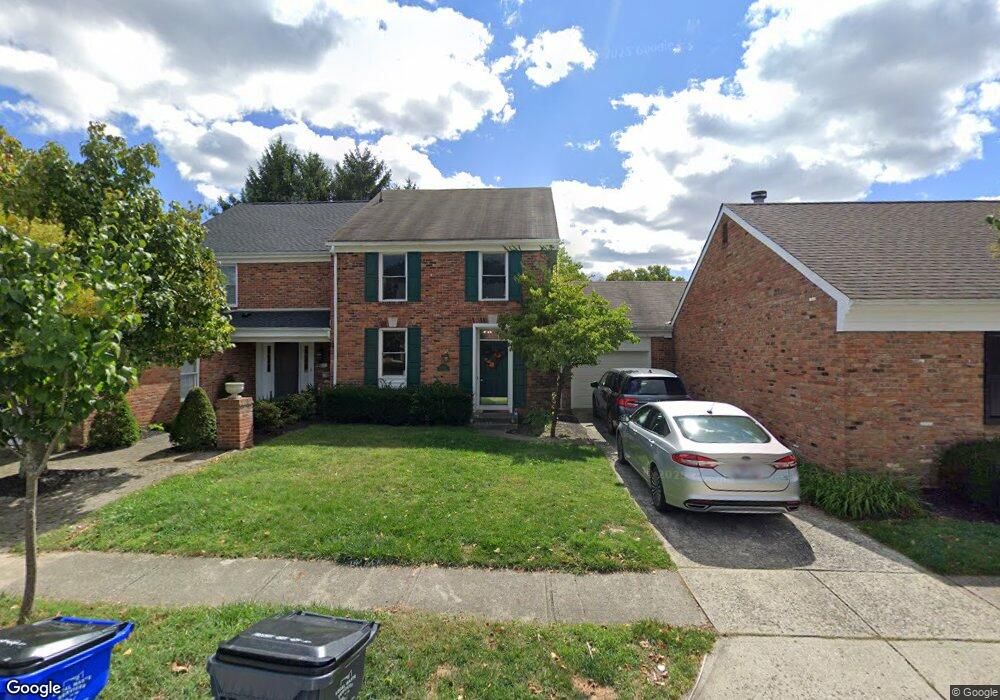
2265 Adner Ct Columbus, OH 43220
Estimated Value: $424,905 - $523,000
3
Beds
3
Baths
1,650
Sq Ft
$293/Sq Ft
Est. Value
About This Home
This home is located at 2265 Adner Ct, Columbus, OH 43220 and is currently estimated at $483,726, approximately $293 per square foot. 2265 Adner Ct is a home located in Franklin County with nearby schools including Greensview Elementary School, Hastings Middle School, and Upper Arlington High School.
Ownership History
Date
Name
Owned For
Owner Type
Purchase Details
Closed on
Aug 8, 2016
Sold by
Rezai Mahnaz
Bought by
Brown George P
Current Estimated Value
Home Financials for this Owner
Home Financials are based on the most recent Mortgage that was taken out on this home.
Original Mortgage
$200,000
Outstanding Balance
$159,577
Interest Rate
3.48%
Mortgage Type
Purchase Money Mortgage
Estimated Equity
$324,149
Purchase Details
Closed on
Apr 19, 2004
Sold by
Schenk Gregory P and Gregory P Schenk Trust
Bought by
Rezai Mahnaz
Purchase Details
Closed on
Mar 3, 1999
Sold by
Schenk Gregory P
Bought by
Gregory P Schenk Trust Agreement
Purchase Details
Closed on
Oct 26, 1988
Bought by
Schenk Gregory P
Purchase Details
Closed on
Sep 1, 1986
Create a Home Valuation Report for This Property
The Home Valuation Report is an in-depth analysis detailing your home's value as well as a comparison with similar homes in the area
Home Values in the Area
Average Home Value in this Area
Purchase History
| Date | Buyer | Sale Price | Title Company |
|---|---|---|---|
| Brown George P | $250,000 | Independent Title Services I | |
| Rezai Mahnaz | $215,000 | Chicago Title | |
| Gregory P Schenk Trust Agreement | -- | -- | |
| Schenk Gregory P | $114,000 | -- | |
| -- | -- | -- |
Source: Public Records
Mortgage History
| Date | Status | Borrower | Loan Amount |
|---|---|---|---|
| Open | Brown George P | $200,000 |
Source: Public Records
Tax History Compared to Growth
Tax History
| Year | Tax Paid | Tax Assessment Tax Assessment Total Assessment is a certain percentage of the fair market value that is determined by local assessors to be the total taxable value of land and additions on the property. | Land | Improvement |
|---|---|---|---|---|
| 2024 | $6,024 | $104,060 | $33,250 | $70,810 |
| 2023 | $5,950 | $104,055 | $33,250 | $70,805 |
| 2022 | $6,614 | $94,650 | $30,210 | $64,440 |
| 2021 | $5,855 | $94,650 | $30,210 | $64,440 |
| 2020 | $5,803 | $94,650 | $30,210 | $64,440 |
| 2019 | $5,910 | $85,230 | $30,210 | $55,020 |
| 2018 | $5,721 | $85,230 | $30,210 | $55,020 |
| 2017 | $5,718 | $85,230 | $30,210 | $55,020 |
| 2016 | $5,571 | $84,250 | $23,980 | $60,270 |
| 2015 | $5,566 | $84,250 | $23,980 | $60,270 |
| 2014 | $5,572 | $84,250 | $23,980 | $60,270 |
| 2013 | $2,787 | $80,220 | $22,820 | $57,400 |
Source: Public Records
Map
Nearby Homes
- 2231 Atlee Ct Unit 12
- 4861 Etrick Dr Unit 22
- 2198 Sandston Rd
- 4781 Coach Rd
- 2165 Partlow Dr
- 2060 Fontenay Place
- 2560 Chartwell Rd
- 4450 Haverford Ct
- 5000 Slate Run Woods Ct
- 4720 Merrifield Place Unit 67
- 2681 Lane Rd
- 5055 Slate Run Woods Ct
- 4499 Summit Ridge Rd
- 4441 Kipling Rd
- 5277 Brandy Oaks Ln
- 5275 Brandy Oaks Ln
- 5273 Brandy Oaks Ln
- 1865 Willoway Cir N Unit 1865
- 3715 Henderson Rd
- 5283 Ruthton Rd Unit 19
- 2269 Adner Ct
- 2259 Adner Ct
- 2255 Adner Ct
- 2264 Montague Ct
- 2268 Montague Ct
- 2258 Montague Ct
- 2247 Adner Ct
- 2252 Montague Ct
- 2312 Sedgwick Dr
- 2262 Adner Ct
- 2308 Sedgwick Dr
- 2266 Adner Ct
- 2256 Adner Ct
- 2316 Sedgwick Dr
- 2241 Adner Ct
- 2304 Sedgwick Dr
- 2244 Montague Ct
- 2250 Adner Ct
- 2320 Sedgwick Dr
- 2300 Sedgwick Dr