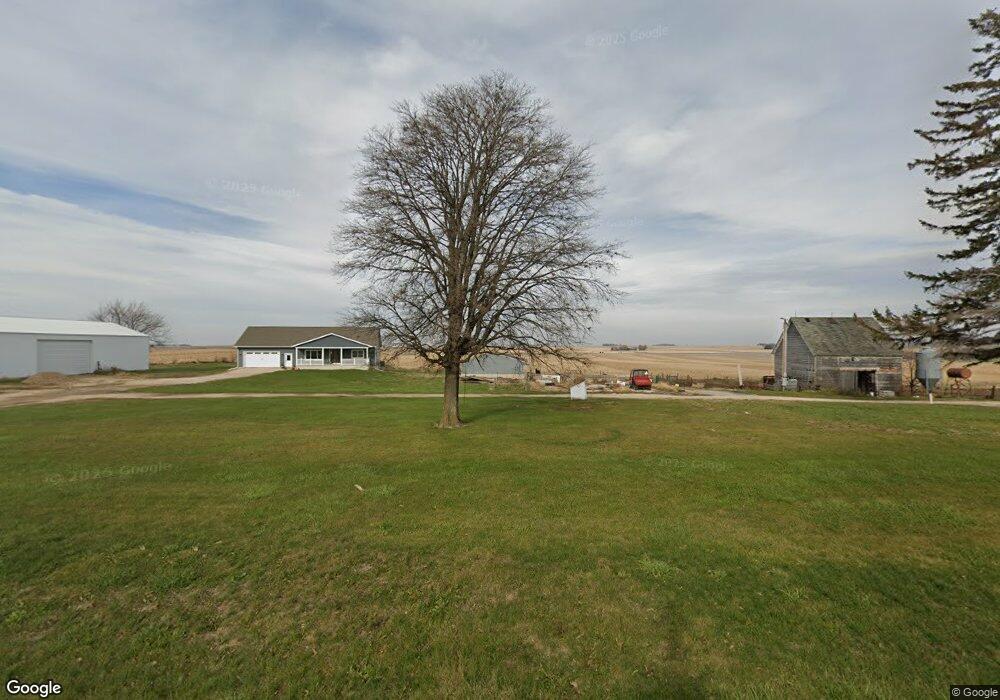
22659 180th St Allison, IA 50602
Estimated Value: $251,000 - $696,737
4
Beds
2
Baths
1,904
Sq Ft
$249/Sq Ft
Est. Value
About This Home
This home is located at 22659 180th St, Allison, IA 50602 and is currently estimated at $473,869, approximately $248 per square foot. 22659 180th St is a home located in Butler County with nearby schools including North Butler Elementary and North Butler Junior/Senior High School.
Ownership History
Date
Name
Owned For
Owner Type
Purchase Details
Closed on
Nov 21, 2014
Sold by
Conservatorship Of Gary Wangsness
Bought by
Wangsness David A and Wangsness Sheila K
Current Estimated Value
Home Financials for this Owner
Home Financials are based on the most recent Mortgage that was taken out on this home.
Original Mortgage
$15,700
Outstanding Balance
$9,472
Interest Rate
5.75%
Mortgage Type
Adjustable Rate Mortgage/ARM
Estimated Equity
$464,397
Purchase Details
Closed on
Nov 18, 2014
Sold by
Wangsness Debra
Bought by
Wangsness David A and Wangsness Sheila K
Home Financials for this Owner
Home Financials are based on the most recent Mortgage that was taken out on this home.
Original Mortgage
$15,700
Outstanding Balance
$9,472
Interest Rate
5.75%
Mortgage Type
Adjustable Rate Mortgage/ARM
Estimated Equity
$464,397
Create a Home Valuation Report for This Property
The Home Valuation Report is an in-depth analysis detailing your home's value as well as a comparison with similar homes in the area
Home Values in the Area
Average Home Value in this Area
Purchase History
| Date | Buyer | Sale Price | Title Company |
|---|---|---|---|
| Wangsness David A | -- | None Available | |
| Wangsness David A | -- | None Available |
Source: Public Records
Mortgage History
| Date | Status | Borrower | Loan Amount |
|---|---|---|---|
| Open | Wangsness David A | $15,700 | |
| Open | Wangsness David A | $62,800 |
Source: Public Records
Tax History Compared to Growth
Tax History
| Year | Tax Paid | Tax Assessment Tax Assessment Total Assessment is a certain percentage of the fair market value that is determined by local assessors to be the total taxable value of land and additions on the property. | Land | Improvement |
|---|---|---|---|---|
| 2024 | $4,806 | $449,440 | $4,250 | $445,190 |
| 2023 | $4,540 | $449,440 | $4,250 | $445,190 |
| 2022 | $4,298 | $355,810 | $3,270 | $352,540 |
| 2021 | $4,224 | $355,810 | $3,270 | $352,540 |
| 2020 | $4,224 | $321,940 | $3,220 | $318,720 |
| 2019 | $750 | $64,530 | $3,220 | $318,720 |
| 2018 | $736 | $64,530 | $0 | $0 |
| 2017 | $790 | $70,930 | $0 | $0 |
| 2016 | $818 | $70,930 | $0 | $0 |
| 2015 | $818 | $79,260 | $0 | $0 |
| 2014 | $888 | $79,260 | $0 | $0 |
Source: Public Records
Map
Nearby Homes