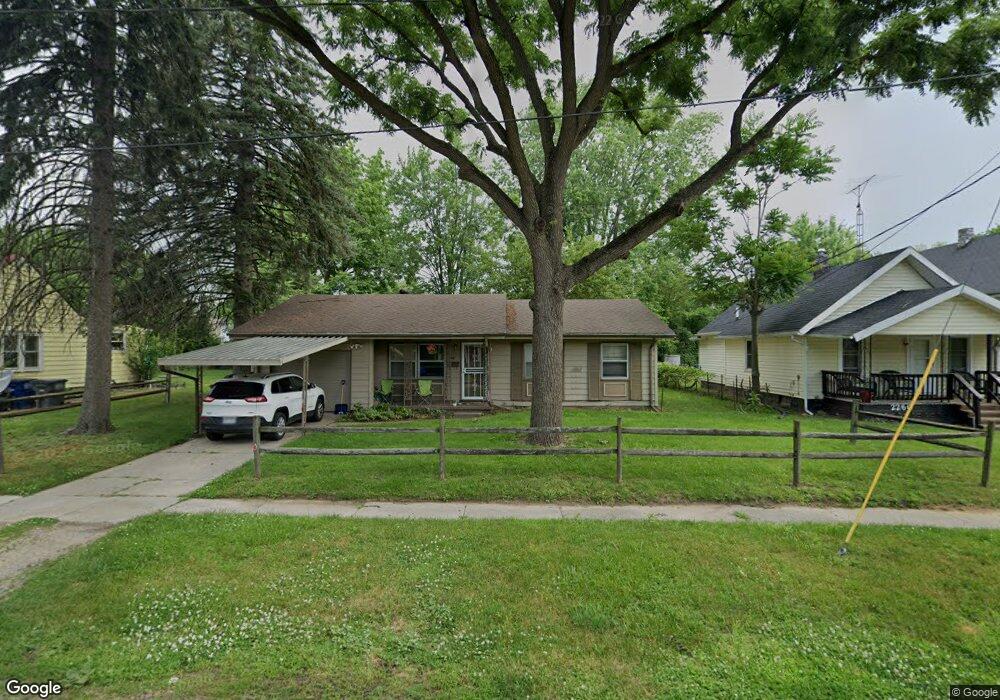
2266 Forrer St Toledo, OH 43607
Scott Park NeighborhoodEstimated Value: $78,000 - $118,000
3
Beds
2
Baths
1,224
Sq Ft
$80/Sq Ft
Est. Value
About This Home
This home is located at 2266 Forrer St, Toledo, OH 43607 and is currently estimated at $97,703, approximately $79 per square foot. 2266 Forrer St is a home located in Lucas County with nearby schools including Jesup W. Scott High School, Explorers Academy, and Explorers Academy of Science and Technology.
Ownership History
Date
Name
Owned For
Owner Type
Purchase Details
Closed on
Dec 10, 2007
Sold by
Deutsche Bank National Trust Co
Bought by
Alexander Marie A
Current Estimated Value
Home Financials for this Owner
Home Financials are based on the most recent Mortgage that was taken out on this home.
Original Mortgage
$22,400
Outstanding Balance
$13,985
Interest Rate
6.3%
Mortgage Type
Purchase Money Mortgage
Estimated Equity
$83,718
Purchase Details
Closed on
Mar 23, 2007
Sold by
Perryman Brian S and Fansler Michael E
Bought by
Deutsche Bank National Trust Co
Purchase Details
Closed on
Oct 20, 2005
Sold by
Fansler Michael E
Bought by
Perryman Brian S
Home Financials for this Owner
Home Financials are based on the most recent Mortgage that was taken out on this home.
Original Mortgage
$78,300
Interest Rate
8.6%
Mortgage Type
Fannie Mae Freddie Mac
Purchase Details
Closed on
May 16, 2005
Sold by
Merrell Kenneth and Merrell Regina M
Bought by
Fansler Michael E
Create a Home Valuation Report for This Property
The Home Valuation Report is an in-depth analysis detailing your home's value as well as a comparison with similar homes in the area
Home Values in the Area
Average Home Value in this Area
Purchase History
| Date | Buyer | Sale Price | Title Company |
|---|---|---|---|
| Alexander Marie A | $28,000 | Sovereign Title Agency Llc | |
| Deutsche Bank National Trust Co | $60,000 | None Available | |
| Perryman Brian S | $87,000 | Netco | |
| Fansler Michael E | $36,000 | Metro Title Agency Inc |
Source: Public Records
Mortgage History
| Date | Status | Borrower | Loan Amount |
|---|---|---|---|
| Open | Alexander Marie A | $22,400 | |
| Previous Owner | Perryman Brian S | $78,300 |
Source: Public Records
Tax History
| Year | Tax Paid | Tax Assessment Tax Assessment Total Assessment is a certain percentage of the fair market value that is determined by local assessors to be the total taxable value of land and additions on the property. | Land | Improvement |
|---|---|---|---|---|
| 2025 | -- | $13,195 | $4,795 | $8,400 |
| 2024 | $520 | $13,195 | $4,795 | $8,400 |
| 2023 | $905 | $10,500 | $3,885 | $6,615 |
| 2022 | $883 | $10,500 | $3,885 | $6,615 |
| 2021 | $918 | $10,500 | $3,885 | $6,615 |
| 2020 | $926 | $8,820 | $3,255 | $5,565 |
| 2019 | $878 | $8,820 | $3,255 | $5,565 |
| 2018 | $908 | $8,820 | $3,255 | $5,565 |
| 2017 | $861 | $8,610 | $4,340 | $4,270 |
| 2016 | $894 | $24,600 | $12,400 | $12,200 |
| 2015 | $1,088 | $24,600 | $12,400 | $12,200 |
| 2014 | $556 | $8,610 | $4,340 | $4,270 |
| 2013 | $556 | $8,610 | $4,340 | $4,270 |
Source: Public Records
Map
Nearby Homes
- 811 N University Ave
- 913 Coventry Ave
- 824 N University Ave
- 1011 Alldays Ave
- 2145 Dorr St
- 1215 Woodstock Ave
- 933 Waverly Ave
- 605 Waverly Ave
- 1004 Waverly Ave
- 1318 Addington Rd
- 2033 Crosswell Place
- 508 Ascot Ave
- 1408 Roosevelt Ave
- 336 Conrad Ave
- 1424 Addington Rd
- 1316 Shenandoah Rd
- 1732 Evansdale Ave
- 1211 Manila St
- 1938 Fernwood Ave
- 1420 Upton Ave
- 2260 Forrer St
- 2272 Forrer St
- 2258 Forrer St
- 2276 Forrer St
- 2254 Forrer St
- 2265 Avondale Ave
- 2269 Avondale Ave
- 2265 Forrer St
- 2271 Avondale Ave
- 2273 Avondale Ave
- 2261 Forrer St
- 2255 Avondale Ave
- 2277 Avondale Ave
- 2251 Avondale Ave
- 2259 Forrer St
- 2279 Avondale Ave
- 813 N University Ave
- 805 N University Ave
- 2249 Avondale Ave
- 815 N University Ave
Your Personal Tour Guide
Ask me questions while you tour the home.