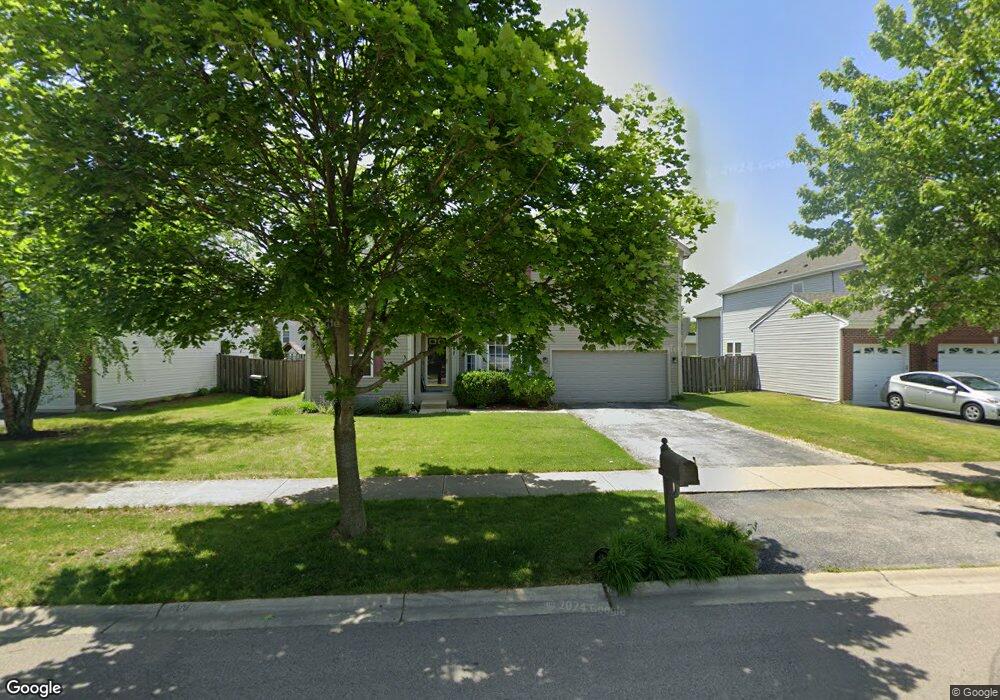
2267 Bellingham Ln Unit 5 Aurora, IL 60503
Far Southeast NeighborhoodEstimated Value: $435,606 - $534,000
--
Bed
1
Bath
2,609
Sq Ft
$183/Sq Ft
Est. Value
About This Home
This home is located at 2267 Bellingham Ln Unit 5, Aurora, IL 60503 and is currently estimated at $477,402, approximately $182 per square foot. 2267 Bellingham Ln Unit 5 is a home located in Will County with nearby schools including The Wheatlands Elementary School, Bednarcik Jr. High School, and Oswego East High School.
Ownership History
Date
Name
Owned For
Owner Type
Purchase Details
Closed on
Sep 26, 2017
Sold by
Ross Christopher
Bought by
Ross Amy
Current Estimated Value
Purchase Details
Closed on
Dec 15, 2003
Sold by
Cahill Timothy D and Cahill Amber Joy
Bought by
Ross Christopher R and Ross Amy
Home Financials for this Owner
Home Financials are based on the most recent Mortgage that was taken out on this home.
Original Mortgage
$218,000
Outstanding Balance
$91,208
Interest Rate
4.5%
Mortgage Type
Purchase Money Mortgage
Estimated Equity
$386,194
Purchase Details
Closed on
Jul 18, 2001
Sold by
Kennedy Homes Ltd Partnership
Bought by
Cahill Timothy D and Cahill Amber Joy
Home Financials for this Owner
Home Financials are based on the most recent Mortgage that was taken out on this home.
Original Mortgage
$185,300
Interest Rate
7.22%
Create a Home Valuation Report for This Property
The Home Valuation Report is an in-depth analysis detailing your home's value as well as a comparison with similar homes in the area
Home Values in the Area
Average Home Value in this Area
Purchase History
| Date | Buyer | Sale Price | Title Company |
|---|---|---|---|
| Ross Amy | -- | None Available | |
| Ross Christopher R | $272,500 | Ticor Title | |
| Cahill Timothy D | $232,000 | First American Title |
Source: Public Records
Mortgage History
| Date | Status | Borrower | Loan Amount |
|---|---|---|---|
| Open | Ross Christopher R | $218,000 | |
| Previous Owner | Cahill Timothy D | $185,300 |
Source: Public Records
Tax History Compared to Growth
Tax History
| Year | Tax Paid | Tax Assessment Tax Assessment Total Assessment is a certain percentage of the fair market value that is determined by local assessors to be the total taxable value of land and additions on the property. | Land | Improvement |
|---|---|---|---|---|
| 2024 | $9,447 | $116,380 | $30,881 | $85,499 |
| 2023 | $9,447 | $102,809 | $27,280 | $75,529 |
| 2022 | $8,682 | $93,242 | $25,805 | $67,437 |
| 2021 | $8,625 | $88,802 | $24,576 | $64,226 |
| 2020 | $8,256 | $87,395 | $24,187 | $63,208 |
| 2019 | $8,341 | $84,932 | $23,505 | $61,427 |
| 2018 | $8,659 | $85,148 | $22,988 | $62,160 |
| 2017 | $8,515 | $82,950 | $22,395 | $60,555 |
| 2016 | $8,534 | $81,164 | $21,913 | $59,251 |
| 2015 | $8,445 | $78,042 | $21,070 | $56,972 |
| 2014 | $8,445 | $71,840 | $21,070 | $50,770 |
| 2013 | $8,445 | $71,840 | $21,070 | $50,770 |
Source: Public Records
Map
Nearby Homes
- 2295 Twilight Dr
- 2310 Twilight Dr
- 2357 Twilight Dr
- 2326 Sunshine Ln Unit 1969
- 3302 Wildlight Rd
- 3328 Fulshear Cir
- 3237 Peyton Cir
- 1769 Baler Ave
- 3235 Kimblewick Cir
- 2232 Daybreak Dr
- 2234 Daybreak Dr
- 2197 Wilson Creek Cir Unit 3
- 1722 Baler Ave
- 1728 Baler Ave
- 1716 Baler Ave
- 1734 Baler Ave
- 2495 Hafenrichter Rd
- 1961 Wilson Creek Cir
- 2047 James Leigh Dr
- 1966 Congrove Dr
- 2277 Bellingham Ln Unit 5
- 2257 Bellingham Ln
- 2257 Barrington Dr W
- 2288 Boxford Ct Unit 5
- 2287 Bellingham Ln
- 2278 Boxford Ct
- 2264 Bellingham Ln
- 2274 Bellingham Ln
- 2254 Bellingham Ln
- 2297 Bellingham Ln Unit 5
- 2247 Barrington Dr W Unit 5
- 2298 Boxford Ct Unit 5
- 2284 Bellingham Ln Unit 5
- 2275 Boxford Ct Unit 5
- 2288 Bellingham Ln
- 2237 Barrington Dr W Unit 5
- 2317 Bellingham Ln
- 2308 Boxford Ln
- 2294 Bellingham Ln
- 2307 Twilight Dr