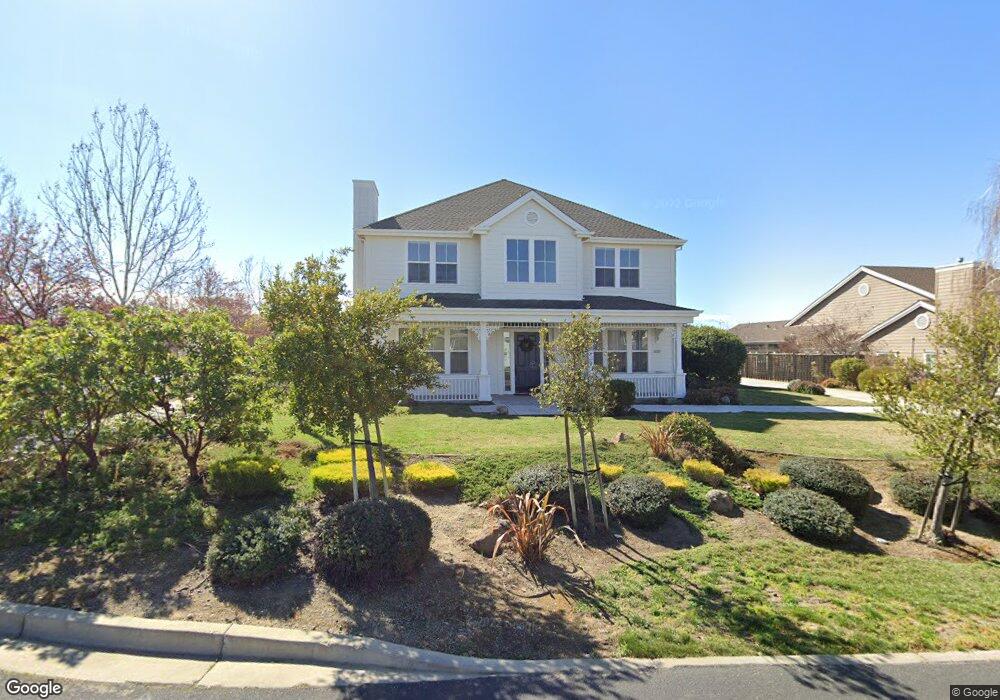
2267 Sevillano Ct Livermore, CA 94550
Estimated Value: $2,653,000 - $2,956,000
6
Beds
6
Baths
4,642
Sq Ft
$604/Sq Ft
Est. Value
About This Home
This home is located at 2267 Sevillano Ct, Livermore, CA 94550 and is currently estimated at $2,805,503, approximately $604 per square foot. 2267 Sevillano Ct is a home located in Alameda County with nearby schools including William Mendenhall Middle School, Granada High School, and St Michael's School.
Ownership History
Date
Name
Owned For
Owner Type
Purchase Details
Closed on
Feb 25, 2010
Sold by
Kilday Roger W and Kilday Margaret M
Bought by
Kilday Margaret M
Current Estimated Value
Home Financials for this Owner
Home Financials are based on the most recent Mortgage that was taken out on this home.
Original Mortgage
$240,000
Outstanding Balance
$158,988
Interest Rate
4.97%
Mortgage Type
New Conventional
Estimated Equity
$2,646,515
Purchase Details
Closed on
Nov 24, 2003
Sold by
Pulte Home Corp
Bought by
Kilday Roger W and Kilday Margaret M
Home Financials for this Owner
Home Financials are based on the most recent Mortgage that was taken out on this home.
Original Mortgage
$322,700
Interest Rate
6%
Mortgage Type
Purchase Money Mortgage
Create a Home Valuation Report for This Property
The Home Valuation Report is an in-depth analysis detailing your home's value as well as a comparison with similar homes in the area
Home Values in the Area
Average Home Value in this Area
Purchase History
| Date | Buyer | Sale Price | Title Company |
|---|---|---|---|
| Kilday Margaret M | -- | Old Republic Title Company | |
| Kilday Roger W | $1,180,000 | First American Title Guarant |
Source: Public Records
Mortgage History
| Date | Status | Borrower | Loan Amount |
|---|---|---|---|
| Open | Kilday Margaret M | $240,000 | |
| Closed | Kilday Roger W | $322,700 | |
| Closed | Kilday Roger W | $100,000 |
Source: Public Records
Tax History Compared to Growth
Tax History
| Year | Tax Paid | Tax Assessment Tax Assessment Total Assessment is a certain percentage of the fair market value that is determined by local assessors to be the total taxable value of land and additions on the property. | Land | Improvement |
|---|---|---|---|---|
| 2025 | $20,846 | $1,669,906 | $503,143 | $1,173,763 |
| 2024 | $20,846 | $1,637,033 | $493,279 | $1,150,754 |
| 2023 | $20,566 | $1,611,797 | $483,607 | $1,128,190 |
| 2022 | $20,269 | $1,573,198 | $474,126 | $1,106,072 |
| 2021 | $19,129 | $1,542,225 | $464,833 | $1,084,392 |
| 2020 | $19,269 | $1,533,350 | $460,070 | $1,073,280 |
| 2019 | $19,422 | $1,503,284 | $451,049 | $1,052,235 |
| 2018 | $19,036 | $1,473,808 | $442,205 | $1,031,603 |
| 2017 | $18,508 | $1,444,910 | $433,534 | $1,011,376 |
| 2016 | $17,907 | $1,416,578 | $425,033 | $991,545 |
| 2015 | $16,756 | $1,395,300 | $418,649 | $976,651 |
| 2014 | $16,488 | $1,367,971 | $410,449 | $957,522 |
Source: Public Records
Map
Nearby Homes
- 2323 Grosvenor Heights Ct Unit C
- 2858 Superior Dr
- 2583 Regent Rd
- 2553 Regent Rd
- 1484 Heidelberg Dr
- 2276 Stonebridge Rd
- 2772 San Minete Dr
- 1110 Lomitas Ave
- 1467 Hudson Way
- 1734 Catalina Ct
- 3080 Bresso Dr
- 2597 Ancona Cir
- 1909 De Vaca Way
- 1004 Vienna St
- 1810 Peary Way
- 1153 Sherry Way
- 2203 Sherry Ct
- 601 Orion Way
- 1077 Aberdeen Ave
- 2211 College Ave
- 2245 Sevillano Ct
- 2311 Sevillano Cir
- 2223 Sevillano Ct
- 2278 Sevillano Ct
- 2256 Sevillano Ct
- 2333 Sevillano Cir
- 2201 Sevillano Ct
- 2234 Sevillano Ct
- 2212 Sevillano Ct
- 2268 Leccino Ct
- 2355 Sevillano Cir
- 2296 Leccino Ct
- 2306 Pendolino Ln
- 2232 Leccino Ct
- 2463 Sevillano Cir
- 2451 Sevillano Cir
- 2485 Sevillano Cir
- 2439 Sevillano Cir
- 2377 Sevillano Cir
- 2210 Leccino Ct