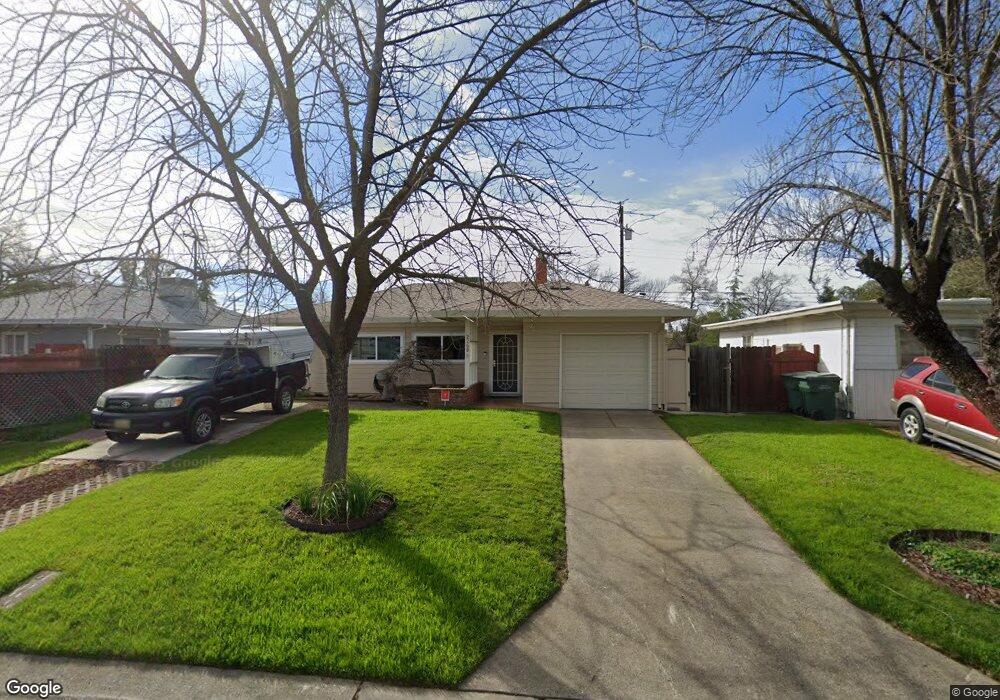
2268 La Paloma Way Sacramento, CA 95825
Fulton-El Camino NeighborhoodEstimated Value: $279,000 - $388,000
2
Beds
1
Bath
1,124
Sq Ft
$304/Sq Ft
Est. Value
About This Home
This home is located at 2268 La Paloma Way, Sacramento, CA 95825 and is currently estimated at $341,680, approximately $303 per square foot. 2268 La Paloma Way is a home located in Sacramento County with nearby schools including Howe Avenue Elementary School, Encina Preparatory High School, and Aspire Alexander Twilight College Preparatory Academy.
Ownership History
Date
Name
Owned For
Owner Type
Purchase Details
Closed on
May 21, 2021
Sold by
Kaylen H John
Bought by
Kaylen H John
Current Estimated Value
Purchase Details
Closed on
Apr 18, 1994
Sold by
Distel Leo
Bought by
Kaylen H John
Home Financials for this Owner
Home Financials are based on the most recent Mortgage that was taken out on this home.
Original Mortgage
$107,100
Interest Rate
7.67%
Mortgage Type
VA
Create a Home Valuation Report for This Property
The Home Valuation Report is an in-depth analysis detailing your home's value as well as a comparison with similar homes in the area
Home Values in the Area
Average Home Value in this Area
Purchase History
| Date | Buyer | Sale Price | Title Company |
|---|---|---|---|
| Kaylen H John | -- | None Available | |
| Kaylen H John | -- | American Title Insurance Co | |
| Kaylen H John | -- | American Title Insurance Co | |
| Kaylen H John | -- | American Title Insurance Co | |
| Kaylen H John | -- | American Title Insurance Co | |
| Kaylen H John | -- | American Title Insurance Co | |
| Kaylen H John | $107,500 | American Title Insurance Co | |
| Distel Leo | $107,500 | American Title Insurance Co | |
| Distel Richard | $107,500 | American Title Insurance Co | |
| Distel Ted | $107,500 | American Title Insurance Co | |
| Distel Joseph | $107,500 | American Title Insurance Co |
Source: Public Records
Mortgage History
| Date | Status | Borrower | Loan Amount |
|---|---|---|---|
| Previous Owner | Distel Joseph | $107,100 |
Source: Public Records
Tax History Compared to Growth
Tax History
| Year | Tax Paid | Tax Assessment Tax Assessment Total Assessment is a certain percentage of the fair market value that is determined by local assessors to be the total taxable value of land and additions on the property. | Land | Improvement |
|---|---|---|---|---|
| 2025 | $2,085 | $178,428 | $101,961 | $76,467 |
| 2024 | $2,085 | $174,930 | $99,962 | $74,968 |
| 2023 | $2,030 | $171,501 | $98,002 | $73,499 |
| 2022 | $2,016 | $168,139 | $96,081 | $72,058 |
| 2021 | $1,981 | $164,844 | $94,198 | $70,646 |
| 2020 | $1,942 | $163,155 | $93,233 | $69,922 |
| 2019 | $1,901 | $159,956 | $91,405 | $68,551 |
| 2018 | $1,875 | $156,820 | $89,613 | $67,207 |
| 2017 | $1,856 | $153,746 | $87,856 | $65,890 |
| 2016 | $1,734 | $150,733 | $86,134 | $64,599 |
| 2015 | $1,703 | $148,470 | $84,841 | $63,629 |
| 2014 | $1,666 | $145,563 | $83,180 | $62,383 |
Source: Public Records
Map
Nearby Homes
- 2410 Post Oak Ln
- 2100 Bowling Green Dr
- 2106 Keith Way
- 2433 Gwen Dr
- 2133 Cortez Ln
- 2108 Tevis Rd
- 2001 Bowling Green Dr
- 2416 Wulff Ln
- 2117 Violet St
- 2012 El Camino Ave
- 2500 Ethan Way
- 2513 Anna Way
- 2405 Ethan Way
- 2620 Darwin St
- 2436 Connie Dr
- 2350 Wyda Way
- 2356 Wyda Way
- 2350 Alta Garden Ln Unit B
- 2104 Rockbridge Rd
- 2362 Alta Garden Ln Unit B
- 2264 La Paloma Way
- 2271 Bell St
- 2269 La Paloma Way
- 2300 Barcelona Way
- 2301 Bell St
- 2260 La Paloma Way
- 2260 La Paloma Ave
- 2304 Barcelona Way
- 2305 Bell St
- 2301 Barcelona Way
- 2256 La Paloma Way
- 2300 Bell St
- 2304 Bell St
- 2309 Bell St
- 2308 Barcelona Way
- 2257 La Paloma Way
- 2305 Barcelona Way
- 2252 La Paloma Way
- 2313 Bell St
- 2312 Barcelona Way