2269 Blue Creek Rd Cornersville, TN 37047
Estimated Value: $344,000 - $934,086
--
Bed
1
Bath
1,704
Sq Ft
$365/Sq Ft
Est. Value
About This Home
This home is located at 2269 Blue Creek Rd, Cornersville, TN 37047 and is currently estimated at $621,362, approximately $364 per square foot. 2269 Blue Creek Rd is a home located in Marshall County with nearby schools including Cornersville Elementary School and Cornersville School.
Ownership History
Date
Name
Owned For
Owner Type
Purchase Details
Closed on
Feb 12, 2018
Sold by
Harwell Coleman A
Bought by
Harwell Jonathan M and Cumberland Trust Co Etal
Current Estimated Value
Purchase Details
Closed on
Oct 19, 2017
Sold by
Harwell Coleman A
Bought by
Billing Harwell Coleman A and Billing Harwell Kirk Lemoyne
Purchase Details
Closed on
Jan 27, 2017
Sold by
Harwell Ii Coleman A
Bought by
Reh Investments Llc
Purchase Details
Closed on
Jun 5, 2015
Sold by
Harwell Kirk Lemoyne Billing
Bought by
Lambert Harwell Coleman A and O Joe M Lambert C
Purchase Details
Closed on
Feb 15, 2013
Sold by
Fifth Third Bank Co Truste
Bought by
Harwell Kirk Lemoyne Billing and Independence Trust Co Co Trust
Purchase Details
Closed on
Sep 22, 2004
Sold by
Amsouth Bank
Bought by
Harwell Robert E
Purchase Details
Closed on
Sep 9, 2004
Bought by
Harwell Jonathan M & Separate Share Trust
Create a Home Valuation Report for This Property
The Home Valuation Report is an in-depth analysis detailing your home's value as well as a comparison with similar homes in the area
Home Values in the Area
Average Home Value in this Area
Purchase History
| Date | Buyer | Sale Price | Title Company |
|---|---|---|---|
| Harwell Jonathan M | -- | -- | |
| Billing Harwell Coleman A | -- | -- | |
| Reh Investments Llc | -- | -- | |
| Reh Investments Llc | $422,300 | -- | |
| Harwell Thomas C | $422,333 | -- | |
| Harwell Thomas C | -- | -- | |
| Lambert Harwell Coleman A | -- | -- | |
| Harwell Kirk Lemoyne Billing | -- | -- | |
| Harwell Robert E | -- | -- | |
| Harwell Coleman A | -- | -- | |
| Harwell Jonathan M & Separate Share Trust | -- | -- |
Source: Public Records
Tax History Compared to Growth
Tax History
| Year | Tax Paid | Tax Assessment Tax Assessment Total Assessment is a certain percentage of the fair market value that is determined by local assessors to be the total taxable value of land and additions on the property. | Land | Improvement |
|---|---|---|---|---|
| 2024 | $1,264 | $69,525 | $38,875 | $30,650 |
| 2023 | $1,264 | $69,525 | $38,875 | $30,650 |
| 2022 | $1,264 | $69,525 | $38,875 | $30,650 |
| 2021 | $1,546 | $55,000 | $30,350 | $24,650 |
| 2020 | $1,533 | $55,000 | $30,350 | $24,650 |
| 2019 | $1,533 | $54,525 | $30,350 | $24,175 |
| 2018 | $3,320 | $54,525 | $30,350 | $24,175 |
| 2017 | $3,320 | $120,200 | $84,325 | $35,875 |
| 2016 | $3,091 | $96,000 | $66,750 | $29,250 |
| 2015 | $3,091 | $96,000 | $66,750 | $29,250 |
| 2014 | $3,206 | $99,550 | $70,275 | $29,275 |
Source: Public Records
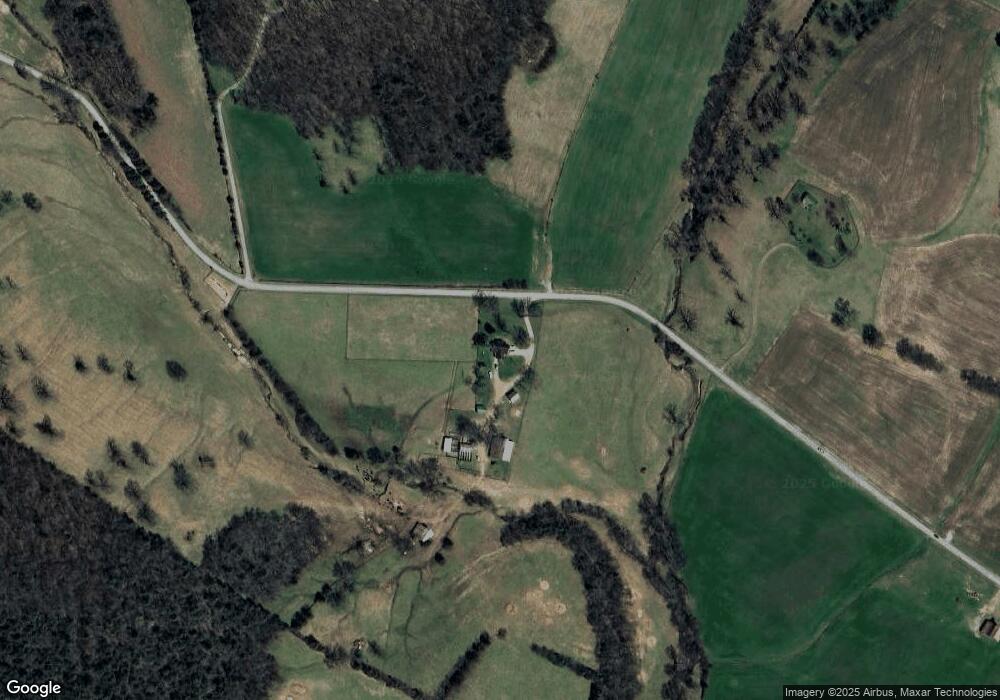
Map
Nearby Homes
- 2846 Fuller Hollow Rd
- 2165 Claude Fox Rd
- 2733 Mcconnell Rd
- 300 Daytona Dr
- 315 Daytona Dr
- 430 Daytona Dr
- 121 Talladega Way
- 2337 Claude Fox Rd
- 307 Front View St
- 502 S Main St
- 3308 Walter's Ct
- 3307 Kathleen's Ct
- 3311 Kathleen's Ct
- 3030 Cherry Corner Rd
- 208 S Mulberry St
- 4923 Blue Creek Rd
- 3 Hatchett Hollow Rd
- 9438 Lewisburg Hwy E
- 200 Tarpley Ave
- 2533 Otis Fowler Rd
- 2300 Blue Creek Rd
- 2 Pulaski Hwy
- 2220 Charlie Thomas Rd
- 3200 Charlie Thomas Rd
- 2257 Charlie Thomas Rd
- 2097 Edmondson Rd
- 2099 Harwell Ln
- 3119 Pulaski Hwy
- 2055 Harwell Ln
- 2021 Harwell Ln
- 3079 Pulaski Hwy
- 3079 Pulaski Hwy
- 3349 Pulaski Hwy
- 2418 Williams Rd
- 2401 Charlie Thomas Rd
- 2431 Williams Rd
- 2422 Williams Rd
- 2051 Edmondson Rd
- 3065 Pulaski Hwy
- 108 Bulldawg Trail