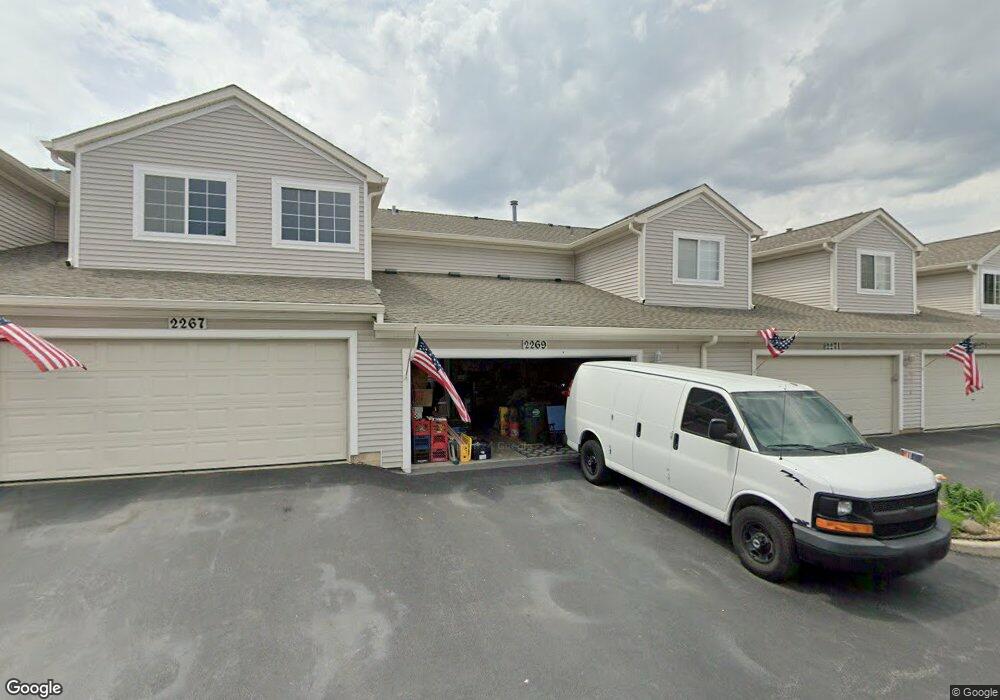
2269 Reflections Dr Unit C1105 Aurora, IL 60502
Eola Yards NeighborhoodEstimated Value: $264,000 - $302,551
2
Beds
1
Bath
1,256
Sq Ft
$222/Sq Ft
Est. Value
About This Home
This home is located at 2269 Reflections Dr Unit C1105, Aurora, IL 60502 and is currently estimated at $279,138, approximately $222 per square foot. 2269 Reflections Dr Unit C1105 is a home located in DuPage County with nearby schools including Nancy Young Elementary School, Francis Granger Middle School, and Metea Valley High School.
Ownership History
Date
Name
Owned For
Owner Type
Purchase Details
Closed on
Sep 24, 2004
Sold by
Wells Ronald L and Wells Lirije
Bought by
Paul Matthew J and Paul Amy C
Current Estimated Value
Home Financials for this Owner
Home Financials are based on the most recent Mortgage that was taken out on this home.
Original Mortgage
$126,000
Outstanding Balance
$66,456
Interest Rate
6.75%
Mortgage Type
Stand Alone First
Estimated Equity
$212,682
Purchase Details
Closed on
Dec 1, 1999
Sold by
Montalbano Builders Inc
Bought by
Wells Ronald L and Wells Lirije
Home Financials for this Owner
Home Financials are based on the most recent Mortgage that was taken out on this home.
Original Mortgage
$115,964
Interest Rate
8.02%
Mortgage Type
FHA
Create a Home Valuation Report for This Property
The Home Valuation Report is an in-depth analysis detailing your home's value as well as a comparison with similar homes in the area
Home Values in the Area
Average Home Value in this Area
Purchase History
| Date | Buyer | Sale Price | Title Company |
|---|---|---|---|
| Paul Matthew J | $157,500 | Multiple | |
| Wells Ronald L | $120,000 | -- |
Source: Public Records
Mortgage History
| Date | Status | Borrower | Loan Amount |
|---|---|---|---|
| Open | Paul Matthew J | $126,000 | |
| Previous Owner | Wells Ronald L | $115,964 | |
| Closed | Paul Matthew J | $31,500 |
Source: Public Records
Tax History
| Year | Tax Paid | Tax Assessment Tax Assessment Total Assessment is a certain percentage of the fair market value that is determined by local assessors to be the total taxable value of land and additions on the property. | Land | Improvement |
|---|---|---|---|---|
| 2024 | $4,812 | $71,292 | $19,587 | $51,705 |
| 2023 | $4,556 | $64,060 | $17,600 | $46,460 |
| 2022 | $4,417 | $58,670 | $16,120 | $42,550 |
| 2021 | $4,290 | $56,570 | $15,540 | $41,030 |
| 2020 | $4,342 | $56,570 | $15,540 | $41,030 |
| 2019 | $4,176 | $53,800 | $14,780 | $39,020 |
| 2018 | $3,613 | $46,910 | $12,890 | $34,020 |
| 2017 | $3,543 | $45,320 | $12,450 | $32,870 |
| 2016 | $3,466 | $43,490 | $11,950 | $31,540 |
| 2015 | $3,415 | $41,300 | $11,350 | $29,950 |
| 2014 | $3,073 | $36,840 | $10,130 | $26,710 |
| 2013 | $3,044 | $37,100 | $10,200 | $26,900 |
Source: Public Records
Map
Nearby Homes
- 1048 Asbury Dr
- 2321 Hudson Cir Unit 2701
- 530 Wolverine Dr
- 452 Jamestown Ct Unit 506
- 2333 Stoughton Cir Unit 350206
- 1900 E New York St
- 369 Vaughn Cir
- 1078 Parkhill Cir
- 255 Vaughn Rd
- 253 Vaughn Rd
- 251 Vaughn Rd
- 249 Vaughn Rd
- 229 Vaughn Rd
- 1015 Woodview Ct
- 247 Vaughn Rd
- 227 Vaughn Rd
- 940 Burnham Ct
- 970 Waterside Ct
- 931 Preserve Ct Unit 2004
- 933 Preserve Ct Unit 2003
- 2267 Reflections Dr Unit C1106
- 2273 Reflections Dr Unit C1103
- 2275 Reflections Dr Unit C1102
- 2277 Reflections Dr Unit C1101
- 2271 Reflections Dr Unit C1104
- 2265 Reflections Dr Unit C1107
- 2289 Reflections Dr Unit C1203
- 2253 Reflections Dr Unit C1005
- 2259 Reflections Dr Unit C1002
- 2291 Reflections Dr Unit C1202
- 2285 Reflections Dr Unit C1205
- 2283 Reflections Dr Unit C1206
- 2293 Reflections Dr Unit C1201
- 2281 Reflections Dr Unit C1207
- 2285 Reflections Dr Unit A
- 2257 Reflections Dr Unit C1003
- 2249 Reflections Dr Unit C1007
- 2247 Reflections Dr Unit C1008
- 2255 Reflections Dr Unit C1004
- 2261 Reflections Dr
Your Personal Tour Guide
Ask me questions while you tour the home.