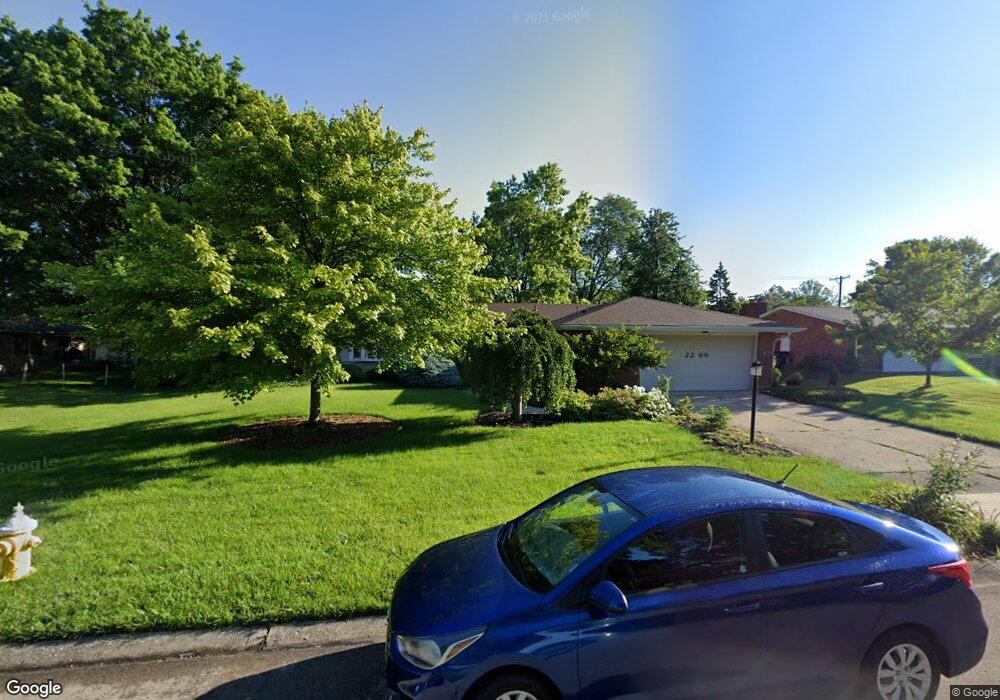
2269 Springmill Rd Dayton, OH 45440
Estimated Value: $304,286 - $336,000
3
Beds
2
Baths
1,775
Sq Ft
$181/Sq Ft
Est. Value
About This Home
This home is located at 2269 Springmill Rd, Dayton, OH 45440 and is currently estimated at $320,572, approximately $180 per square foot. 2269 Springmill Rd is a home located in Montgomery County with nearby schools including John F. Kennedy Elementary School, Kettering Middle School, and Kettering Fairmont High School.
Ownership History
Date
Name
Owned For
Owner Type
Purchase Details
Closed on
Jul 24, 2014
Sold by
Johnson Robert L and Johnson Freda Dana
Bought by
Beans Troy Michael S and Beans Jessica J
Current Estimated Value
Purchase Details
Closed on
Mar 28, 2014
Sold by
Sage Insurance Services Inc
Bought by
Johnson Robert L
Purchase Details
Closed on
Sep 7, 2013
Sold by
Johnson Robert Lee and Dana Freda
Bought by
Sage Insurance Services Inc
Purchase Details
Closed on
Dec 1, 2011
Sold by
Nesbitt Lois J
Bought by
Johnson Robert Lee
Purchase Details
Closed on
Feb 13, 2003
Sold by
Nesbitt Lois J Tr
Bought by
Nesbitt Lois J
Home Financials for this Owner
Home Financials are based on the most recent Mortgage that was taken out on this home.
Original Mortgage
$75,000
Interest Rate
9.5%
Mortgage Type
Purchase Money Mortgage
Purchase Details
Closed on
Apr 8, 1996
Sold by
Nesbitt Raymond B
Bought by
Nesbitt Raymond B and Nesbitt Lois J
Create a Home Valuation Report for This Property
The Home Valuation Report is an in-depth analysis detailing your home's value as well as a comparison with similar homes in the area
Home Values in the Area
Average Home Value in this Area
Purchase History
| Date | Buyer | Sale Price | Title Company |
|---|---|---|---|
| Beans Troy Michael S | $155,000 | Fidelity Lawyers Title Agenc | |
| Johnson Robert L | -- | None Available | |
| Sage Insurance Services Inc | -- | None Available | |
| Johnson Robert Lee | -- | None Available | |
| Nesbitt Lois J | -- | -- | |
| Nesbitt Raymond B | -- | -- |
Source: Public Records
Mortgage History
| Date | Status | Borrower | Loan Amount |
|---|---|---|---|
| Previous Owner | Nesbitt Lois J | $75,000 |
Source: Public Records
Tax History
| Year | Tax Paid | Tax Assessment Tax Assessment Total Assessment is a certain percentage of the fair market value that is determined by local assessors to be the total taxable value of land and additions on the property. | Land | Improvement |
|---|---|---|---|---|
| 2025 | $4,882 | $76,530 | $16,810 | $59,720 |
| 2024 | $4,743 | $76,530 | $16,810 | $59,720 |
| 2023 | $4,743 | $76,530 | $16,810 | $59,720 |
| 2022 | $4,619 | $58,940 | $12,930 | $46,010 |
| 2021 | $4,277 | $58,940 | $12,930 | $46,010 |
| 2020 | $4,284 | $58,940 | $12,930 | $46,010 |
| 2019 | $3,980 | $48,400 | $12,930 | $35,470 |
| 2018 | $4,001 | $48,400 | $12,930 | $35,470 |
| 2017 | $3,685 | $48,400 | $12,930 | $35,470 |
| 2016 | $3,496 | $43,130 | $12,930 | $30,200 |
| 2015 | $3,427 | $43,130 | $12,930 | $30,200 |
| 2014 | $3,427 | $43,130 | $12,930 | $30,200 |
| 2012 | -- | $44,400 | $12,900 | $31,500 |
Source: Public Records
Map
Nearby Homes
- 5195 Bigger Rd
- 2360 E Rahn Rd
- 5413 Newell Dr
- 5346 Millcreek Rd
- 2409 E Rahn Rd
- 2324 Belloak Dr
- 2312 E Whipp Rd
- 4820 Rean Meadow Dr
- 2132 Hewitt Ave Unit 12132
- 4769 Bigger Rd
- 6046 N Quinella Way Unit 51246
- 2546 Marscott Dr
- 5508 Red Coach Rd
- 6067 Hackamore Trail Unit 20
- 6085 N Quinella Way Unit 46229
- 2286 Millwood Rd
- 6031 Buggy Whip Ln Unit 87
- 5526 Red Coach Rd
- 5336 Red Coach Rd
- 1820 Piper Ln Unit 104
- 2277 Springmill Rd
- 5240 Bigger Rd
- 2268 E Rahn Rd
- 2276 E Rahn Rd
- 2260 E Rahn Rd
- 2285 Springmill Rd
- 2284 E Rahn Rd
- 2293 Springmill Rd
- 2251 Springmill Rd
- 2292 E Rahn Rd
- 2250 E Rahn Rd
- 5251 Bigger Rd
- 2301 Springmill Rd
- 2300 E Rahn Rd
- 2243 Springmill Rd
- 2269 E Rahn Rd
- 2277 E Rahn Rd
- 5212 Bigger Rd
- 5263 Bigger Rd
- 2242 Springmill Rd
Your Personal Tour Guide
Ask me questions while you tour the home.