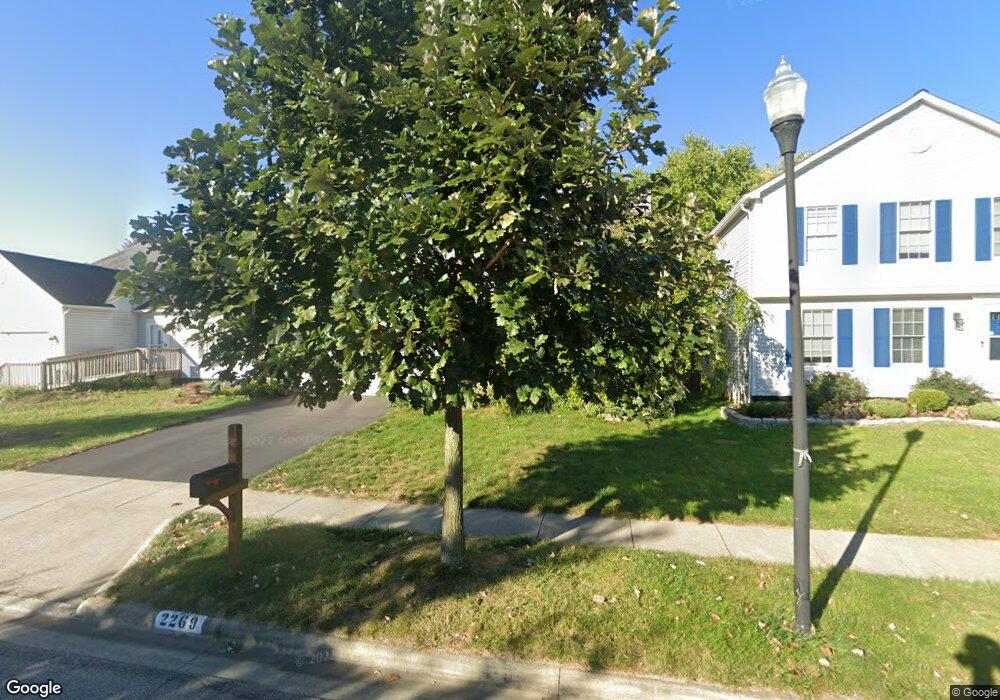
2269 Yagger Bay Dr Hilliard, OH 43026
Hilliard Green NeighborhoodEstimated Value: $417,000 - $457,000
3
Beds
3
Baths
2,300
Sq Ft
$187/Sq Ft
Est. Value
About This Home
This home is located at 2269 Yagger Bay Dr, Hilliard, OH 43026 and is currently estimated at $430,826, approximately $187 per square foot. 2269 Yagger Bay Dr is a home located in Franklin County with nearby schools including Beacon Elementary School, Hilliard Station Sixth Grade Elementary School, and Hilliard Heritage Middle School.
Ownership History
Date
Name
Owned For
Owner Type
Purchase Details
Closed on
Jul 31, 2009
Sold by
Severson Joshua D and Drumm Heather Marie
Bought by
Gaither William L and Fries Gaither Jessica
Current Estimated Value
Home Financials for this Owner
Home Financials are based on the most recent Mortgage that was taken out on this home.
Original Mortgage
$164,000
Interest Rate
5.49%
Mortgage Type
Purchase Money Mortgage
Purchase Details
Closed on
May 30, 2003
Sold by
Fedorovich Todd A and Fedorovich Stephanie A
Bought by
Severson Joshua D and Drumm Heather Marie
Home Financials for this Owner
Home Financials are based on the most recent Mortgage that was taken out on this home.
Original Mortgage
$170,050
Interest Rate
5.78%
Mortgage Type
Purchase Money Mortgage
Purchase Details
Closed on
Jun 2, 1999
Sold by
Dominion Homes Inc
Bought by
Fedorovich Todd A and Fedorovich Stephanie A
Home Financials for this Owner
Home Financials are based on the most recent Mortgage that was taken out on this home.
Original Mortgage
$146,625
Interest Rate
6.94%
Create a Home Valuation Report for This Property
The Home Valuation Report is an in-depth analysis detailing your home's value as well as a comparison with similar homes in the area
Home Values in the Area
Average Home Value in this Area
Purchase History
| Date | Buyer | Sale Price | Title Company |
|---|---|---|---|
| Gaither William L | $194,000 | Attorney | |
| Severson Joshua D | $179,000 | -- | |
| Fedorovich Todd A | $159,400 | Alliance Title |
Source: Public Records
Mortgage History
| Date | Status | Borrower | Loan Amount |
|---|---|---|---|
| Closed | Gaither William L | $164,000 | |
| Closed | Severson Joshua D | $170,050 | |
| Closed | Fedorovich Todd A | $146,625 |
Source: Public Records
Tax History
| Year | Tax Paid | Tax Assessment Tax Assessment Total Assessment is a certain percentage of the fair market value that is determined by local assessors to be the total taxable value of land and additions on the property. | Land | Improvement |
|---|---|---|---|---|
| 2025 | $7,535 | $133,420 | $38,500 | $94,920 |
| 2024 | $7,535 | $133,420 | $38,500 | $94,920 |
| 2023 | $6,528 | $133,420 | $38,500 | $94,920 |
| 2022 | $5,723 | $93,660 | $15,330 | $78,330 |
| 2021 | $5,717 | $93,660 | $15,330 | $78,330 |
| 2020 | $5,701 | $93,660 | $15,330 | $78,330 |
| 2019 | $5,299 | $74,340 | $12,250 | $62,090 |
| 2018 | $4,970 | $74,340 | $12,250 | $62,090 |
| 2017 | $5,125 | $74,340 | $12,250 | $62,090 |
| 2016 | $4,974 | $64,890 | $11,200 | $53,690 |
| 2015 | $4,661 | $64,890 | $11,200 | $53,690 |
| 2014 | $4,670 | $64,890 | $11,200 | $53,690 |
| 2013 | $2,366 | $64,890 | $11,200 | $53,690 |
Source: Public Records
Map
Nearby Homes
- 2252 Yagger Bay Dr
- 5079 Hilliard Green Dr
- 2458 Crystal Springs Dr Unit 2458
- 2465 Meadow Glade Dr Unit 26
- 2477 Crystal Springs Dr
- 4842 Dameuly Dr
- 2464 Meadow Glade Dr Unit 2464
- 0 Hilliard Rome Rd Unit 225040295
- 5138 Roberts Rd
- 4920 Meadow Run Dr Unit 4920
- 5503 Nike Dr
- 2505 Roberts Ct
- 2378 Myrtle Valley Dr
- 5052 Bressler Dr
- 2679 Bramble Dr
- 5034 Hidden View Dr
- 5708 Saucony Dr
- 2763 Ciniminson Ct
- 5151 Singleton Dr Unit 44A
- 5521 Mirage Dr
- 2263 Yagger Bay Dr
- 2275 Yagger Bay Dr
- 2257 Yagger Bay Dr
- 2281 Yagger Bay Dr
- 2251 Yagger Bay Dr
- 2287 Yagger Bay Dr
- 2270 Yagger Bay Dr
- 2264 Yagger Bay Dr
- 2276 Yagger Bay Dr
- 2245 Yagger Bay Dr
- 2258 Yagger Bay Dr
- 2282 Yagger Bay Dr
- 2293 Yagger Bay Dr
- 2294 Yagger Bay Dr
- 2239 Yagger Bay Dr
- 2246 Yagger Bay Dr
- 2299 Yagger Bay Dr
- 2355 Brisum Way
- 2355 Brisum Way Unit 182
- 5141 Bridle Creek Way Unit 2134
Your Personal Tour Guide
Ask me questions while you tour the home.