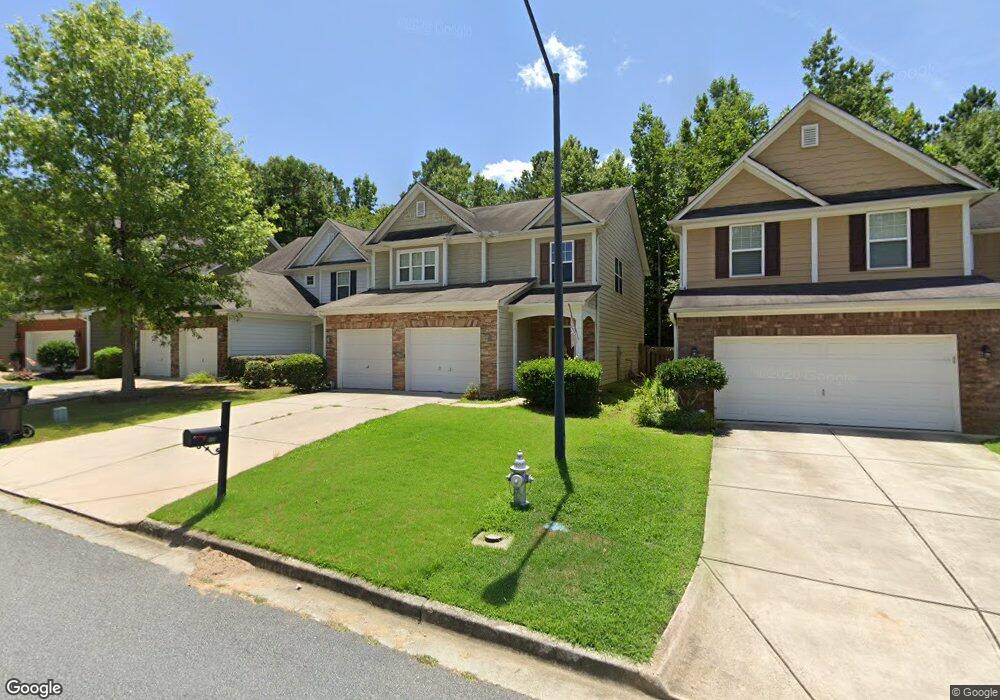
227 Brookhaven Ct Acworth, GA 30102
Oak Grove NeighborhoodEstimated Value: $384,000 - $389,423
3
Beds
3
Baths
1,952
Sq Ft
$198/Sq Ft
Est. Value
About This Home
This home is located at 227 Brookhaven Ct, Acworth, GA 30102 and is currently estimated at $386,712, approximately $198 per square foot. 227 Brookhaven Ct is a home located in Cherokee County with nearby schools including Oak Grove Elementary School, E. T. Booth Middle School, and Etowah High School.
Ownership History
Date
Name
Owned For
Owner Type
Purchase Details
Closed on
Apr 27, 2020
Sold by
Torrance Chesley
Bought by
Beatty Derek and Jenkins Daniella
Current Estimated Value
Home Financials for this Owner
Home Financials are based on the most recent Mortgage that was taken out on this home.
Original Mortgage
$230,743
Outstanding Balance
$204,356
Interest Rate
3.5%
Mortgage Type
FHA
Estimated Equity
$182,356
Purchase Details
Closed on
Jul 19, 2016
Sold by
Jessica
Bought by
Torrance Chelsey and Blosser Justin
Home Financials for this Owner
Home Financials are based on the most recent Mortgage that was taken out on this home.
Original Mortgage
$166,920
Interest Rate
3.56%
Mortgage Type
FHA
Purchase Details
Closed on
Jul 27, 2007
Sold by
Beazer Homes Corp
Bought by
Hughes Jessica
Home Financials for this Owner
Home Financials are based on the most recent Mortgage that was taken out on this home.
Original Mortgage
$139,000
Interest Rate
6.55%
Mortgage Type
New Conventional
Create a Home Valuation Report for This Property
The Home Valuation Report is an in-depth analysis detailing your home's value as well as a comparison with similar homes in the area
Home Values in the Area
Average Home Value in this Area
Purchase History
| Date | Buyer | Sale Price | Title Company |
|---|---|---|---|
| Beatty Derek | $235,000 | -- | |
| Torrance Chelsey | $170,000 | -- | |
| Hughes Jessica | $174,000 | -- |
Source: Public Records
Mortgage History
| Date | Status | Borrower | Loan Amount |
|---|---|---|---|
| Open | Beatty Derek | $230,743 | |
| Previous Owner | Torrance Chelsey | $166,920 | |
| Previous Owner | Hughes Jessica | $139,000 |
Source: Public Records
Tax History Compared to Growth
Tax History
| Year | Tax Paid | Tax Assessment Tax Assessment Total Assessment is a certain percentage of the fair market value that is determined by local assessors to be the total taxable value of land and additions on the property. | Land | Improvement |
|---|---|---|---|---|
| 2025 | $3,512 | $148,516 | $30,000 | $118,516 |
| 2024 | $3,450 | $146,640 | $28,000 | $118,640 |
| 2023 | $2,948 | $143,440 | $28,000 | $115,440 |
| 2022 | $2,860 | $117,000 | $18,800 | $98,200 |
| 2021 | $2,562 | $94,000 | $18,768 | $75,232 |
| 2020 | $2,253 | $85,560 | $18,000 | $67,560 |
| 2019 | $2,103 | $79,080 | $16,000 | $63,080 |
| 2018 | $1,975 | $73,160 | $14,000 | $59,160 |
| 2017 | $1,847 | $170,000 | $14,000 | $54,000 |
| 2016 | $1,847 | $158,600 | $14,000 | $49,440 |
| 2015 | $1,891 | $160,800 | $12,800 | $51,520 |
| 2014 | $1,835 | $155,700 | $11,600 | $50,680 |
Source: Public Records
Map
Nearby Homes
- 240 Ridge Mill Dr
- 108 Creekwood Trail
- 100 Creekwood Trail
- 320 Oak Leaf Place
- 536 Rendezvous Rd
- 5706 Forest Place
- 577 Oakside Place
- 503 Rendezvous Rd
- 517 Rendezvous Rd
- 313 Maltibie Dr
- 153 Centennial Ridge Dr
- 440 Carrera Ln
- 432 Carrera Ln
- 435 Carrera Ln
- 344 Colsen Dr
- 340 Colsen Dr
- 336 Colsen Dr
- 325 Colsen Dr
- 332 Colsen Dr
- 328 Colsen Dr
- 227 Brookhaven Ct
- 229 Brookhaven Ct
- 225 Brookhaven Ct
- 223 Brookhaven Ct
- 231 Brookhaven Ct
- 221 Brookhaven Ct
- 233 Brookhaven Ct
- 216 Brookhaven Ct
- 214 Brookhaven Ct Unit 35
- 214 Brookhaven Ct
- 219 Brookhaven Ct
- 235 Brookhaven Ct
- 212 Brookhaven Ct
- 218 Brookhaven Ct
- 0 Brookhaven Ct Unit 8591792
- 0 Brookhaven Ct Unit 8589552
- 0 Brookhaven Ct Unit 8581967
- 0 Brookhaven Ct Unit 8224490
- 0 Brookhaven Ct Unit 8117284
- 0 Brookhaven Ct Unit 7298646