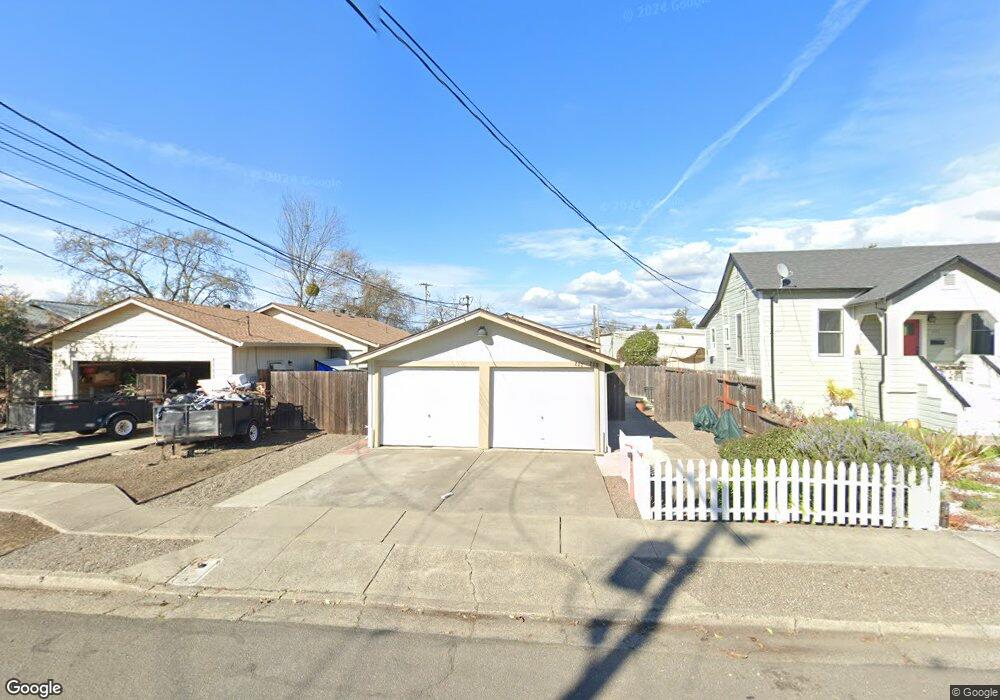
227 Decker St Santa Rosa, CA 95401
Historic Railroad Square NeighborhoodEstimated Value: $484,000 - $742,000
4
Beds
2
Baths
1,240
Sq Ft
$479/Sq Ft
Est. Value
About This Home
This home is located at 227 Decker St, Santa Rosa, CA 95401 and is currently estimated at $594,485, approximately $479 per square foot. 227 Decker St is a home located in Sonoma County with nearby schools including Abraham Lincoln Elementary School, Santa Rosa Middle School, and Santa Rosa High School.
Ownership History
Date
Name
Owned For
Owner Type
Purchase Details
Closed on
Jun 11, 2025
Sold by
Blanz Rebecca L and Blanz Investments Llc
Bought by
Rebecca L Blanz Revocable Trust and Blanz
Current Estimated Value
Purchase Details
Closed on
May 28, 2025
Sold by
Rebecca L Blanz Revocable Trust and Blanz Rebecca L
Bought by
Blanz Investments Llc
Purchase Details
Closed on
Dec 11, 2009
Sold by
Blanz Rebecca L
Bought by
Blanz Rebecca L and Rebecca L Blanz Revocable Trus
Purchase Details
Closed on
Dec 10, 2009
Sold by
Scafani Victor
Bought by
Blanz Rebecca L
Create a Home Valuation Report for This Property
The Home Valuation Report is an in-depth analysis detailing your home's value as well as a comparison with similar homes in the area
Home Values in the Area
Average Home Value in this Area
Purchase History
| Date | Buyer | Sale Price | Title Company |
|---|---|---|---|
| Rebecca L Blanz Revocable Trust | -- | None Listed On Document | |
| Blanz Investments Llc | -- | None Listed On Document | |
| Blanz Rebecca L | -- | None Available | |
| Blanz Rebecca L | $288,000 | First American Title Company | |
| Blanz Rebecca L | -- | First American Title Company |
Source: Public Records
Tax History
| Year | Tax Paid | Tax Assessment Tax Assessment Total Assessment is a certain percentage of the fair market value that is determined by local assessors to be the total taxable value of land and additions on the property. | Land | Improvement |
|---|---|---|---|---|
| 2025 | $4,226 | $371,742 | $148,437 | $223,305 |
| 2024 | $4,226 | $364,454 | $145,527 | $218,927 |
| 2023 | $4,226 | $357,309 | $142,674 | $214,635 |
| 2022 | $3,905 | $350,304 | $139,877 | $210,427 |
| 2021 | $3,858 | $343,436 | $137,135 | $206,301 |
| 2020 | $3,849 | $339,915 | $135,729 | $204,186 |
| 2019 | $3,829 | $333,251 | $133,068 | $200,183 |
| 2018 | $3,808 | $326,717 | $130,459 | $196,258 |
| 2017 | $3,740 | $320,311 | $127,901 | $192,410 |
| 2016 | $3,711 | $314,032 | $125,394 | $188,638 |
| 2015 | $3,599 | $309,316 | $123,511 | $185,805 |
| 2014 | $2,728 | $244,000 | $97,000 | $147,000 |
Source: Public Records
Map
Nearby Homes