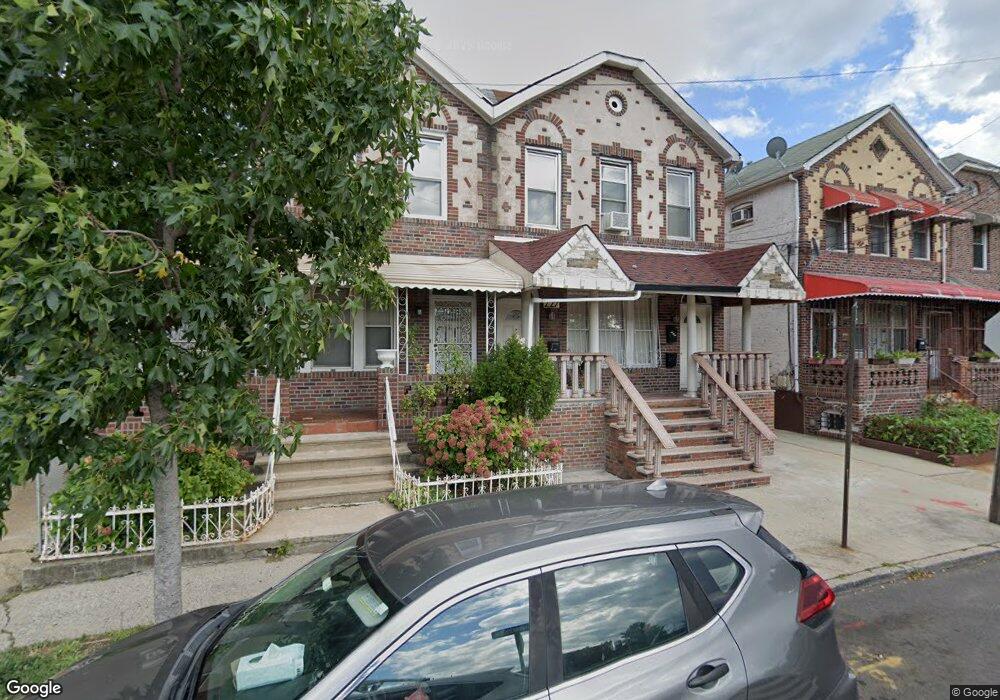
227 E 57th St Brooklyn, NY 11203
East Flatbush NeighborhoodEstimated Value: $863,000 - $1,000,000
Studio
--
Bath
2,720
Sq Ft
$345/Sq Ft
Est. Value
About This Home
This home is located at 227 E 57th St, Brooklyn, NY 11203 and is currently estimated at $937,790, approximately $344 per square foot. 227 E 57th St is a home located in Kings County with nearby schools including Ps 244 Richard R Green, I.S. 285 Meyer Levin, and Ivy Hill Preparatory Charter School.
Ownership History
Date
Name
Owned For
Owner Type
Purchase Details
Closed on
May 31, 2021
Sold by
Mckain Monica E
Bought by
Monica E Mckain Trustee and Monica Mckain Family Trust
Current Estimated Value
Purchase Details
Closed on
Oct 27, 2005
Sold by
Jones Gwendolyn
Bought by
Mckain Monica E
Home Financials for this Owner
Home Financials are based on the most recent Mortgage that was taken out on this home.
Original Mortgage
$437,000
Interest Rate
5.93%
Mortgage Type
Purchase Money Mortgage
Create a Home Valuation Report for This Property
The Home Valuation Report is an in-depth analysis detailing your home's value as well as a comparison with similar homes in the area
Home Values in the Area
Average Home Value in this Area
Purchase History
| Date | Buyer | Sale Price | Title Company |
|---|---|---|---|
| Monica E Mckain Trustee | -- | -- | |
| Mckain Monica E | $460,000 | -- |
Source: Public Records
Mortgage History
| Date | Status | Borrower | Loan Amount |
|---|---|---|---|
| Previous Owner | Mckain Monica E | $437,000 |
Source: Public Records
Tax History
| Year | Tax Paid | Tax Assessment Tax Assessment Total Assessment is a certain percentage of the fair market value that is determined by local assessors to be the total taxable value of land and additions on the property. | Land | Improvement |
|---|---|---|---|---|
| 2025 | $8,012 | $55,740 | $20,400 | $35,340 |
| 2024 | $8,012 | $53,280 | $20,400 | $32,880 |
| 2023 | $7,886 | $53,100 | $20,400 | $32,700 |
| 2022 | $7,313 | $44,760 | $20,400 | $24,360 |
| 2021 | $7,273 | $34,560 | $20,400 | $14,160 |
| 2020 | $3,686 | $41,940 | $20,400 | $21,540 |
| 2019 | $6,954 | $35,820 | $20,400 | $15,420 |
| 2018 | $6,702 | $32,878 | $18,265 | $14,613 |
| 2017 | $6,323 | $31,020 | $17,998 | $13,022 |
| 2016 | $6,201 | $31,020 | $19,211 | $11,809 |
| 2015 | $3,529 | $29,362 | $20,106 | $9,256 |
| 2014 | $3,529 | $27,702 | $16,542 | $11,160 |
Source: Public Records
Map
Nearby Homes
Your Personal Tour Guide
Ask me questions while you tour the home.