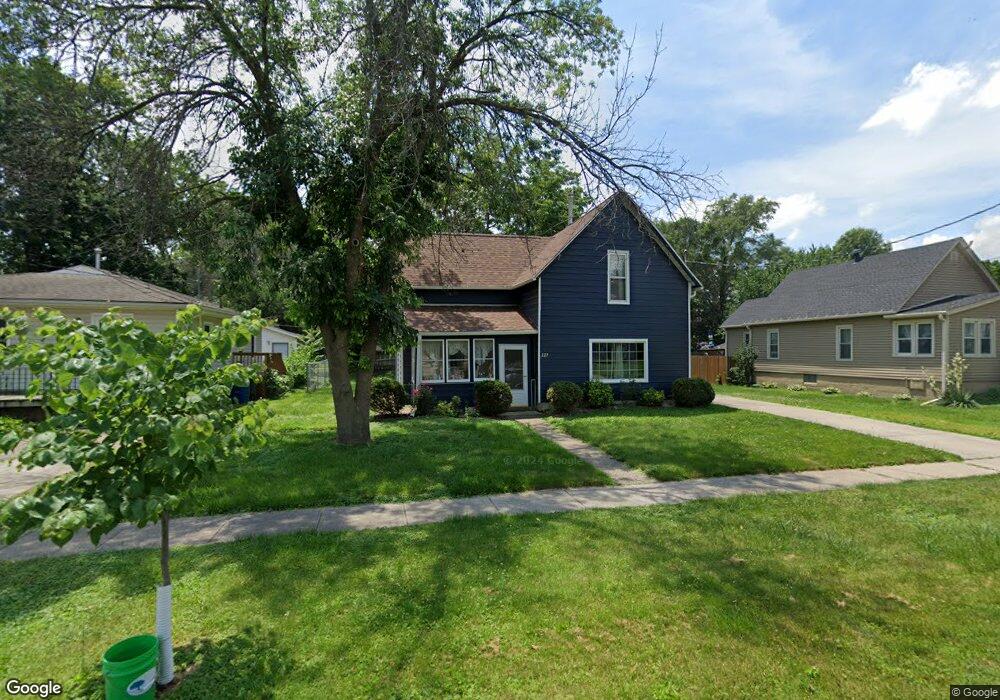
227 E Dunham Ave Des Moines, IA 50315
McKinley School NeighborhoodEstimated Value: $160,000 - $197,000
3
Beds
1
Bath
1,253
Sq Ft
$138/Sq Ft
Est. Value
About This Home
This home is located at 227 E Dunham Ave, Des Moines, IA 50315 and is currently estimated at $173,198, approximately $138 per square foot. 227 E Dunham Ave is a home located in Polk County with nearby schools including McKinley Elementary School, Weeks Middle School, and Lincoln High School.
Ownership History
Date
Name
Owned For
Owner Type
Purchase Details
Closed on
Dec 6, 2002
Sold by
Collins Maria R and Collins Randall
Bought by
Collins Randall and Collins Maria R
Current Estimated Value
Home Financials for this Owner
Home Financials are based on the most recent Mortgage that was taken out on this home.
Original Mortgage
$90,000
Outstanding Balance
$38,334
Interest Rate
6.25%
Estimated Equity
$134,864
Purchase Details
Closed on
Mar 24, 2000
Sold by
Davros Thomas G and Davros Michelle M
Bought by
Collins Maria R
Home Financials for this Owner
Home Financials are based on the most recent Mortgage that was taken out on this home.
Original Mortgage
$70,850
Interest Rate
8.43%
Mortgage Type
FHA
Purchase Details
Closed on
Mar 30, 1999
Sold by
Bassford Susan
Bought by
Davros Thomas G and Davros Michelle M
Home Financials for this Owner
Home Financials are based on the most recent Mortgage that was taken out on this home.
Original Mortgage
$54,400
Interest Rate
12.8%
Create a Home Valuation Report for This Property
The Home Valuation Report is an in-depth analysis detailing your home's value as well as a comparison with similar homes in the area
Home Values in the Area
Average Home Value in this Area
Purchase History
| Date | Buyer | Sale Price | Title Company |
|---|---|---|---|
| Collins Randall | -- | -- | |
| Collins Maria R | $70,500 | -- | |
| Davros Thomas G | $63,500 | -- |
Source: Public Records
Mortgage History
| Date | Status | Borrower | Loan Amount |
|---|---|---|---|
| Open | Collins Randall | $90,000 | |
| Closed | Collins Maria R | $70,850 | |
| Previous Owner | Davros Thomas G | $54,400 |
Source: Public Records
Tax History
| Year | Tax Paid | Tax Assessment Tax Assessment Total Assessment is a certain percentage of the fair market value that is determined by local assessors to be the total taxable value of land and additions on the property. | Land | Improvement |
|---|---|---|---|---|
| 2025 | $2,336 | $150,800 | $25,800 | $125,000 |
| 2024 | $2,336 | $129,200 | $22,000 | $107,200 |
| 2023 | $2,390 | $129,200 | $22,000 | $107,200 |
| 2022 | $2,370 | $110,300 | $19,500 | $90,800 |
| 2021 | $2,194 | $110,300 | $19,500 | $90,800 |
| 2020 | $2,274 | $96,500 | $17,200 | $79,300 |
| 2019 | $2,120 | $96,500 | $17,200 | $79,300 |
| 2018 | $2,094 | $87,400 | $15,500 | $71,900 |
| 2017 | $2,012 | $87,400 | $15,500 | $71,900 |
| 2016 | $1,954 | $82,900 | $14,500 | $68,400 |
| 2015 | $1,954 | $82,900 | $14,500 | $68,400 |
| 2014 | $1,926 | $84,100 | $14,700 | $69,400 |
Source: Public Records
Map
Nearby Homes
- 200 E Granger Ave
- 417 E Granger Ave
- 205 E Livingston Ave
- 425 E Granger Ave
- 1944 SW 1st St
- 202 E Olinda Ave
- 609 E Granger Ave
- 0 Hartford Ave
- 2000 SW 1st St
- 508 Indianola Rd Unit 2
- 818 E Edison Ave
- 550 Indianola Rd Unit 1
- 814 E Edison Ave
- 720 Monona Ave
- 412 Fulton Dr
- 2034 Courtland Dr
- 718 Monona Ave
- 501 Olinda Ave
- 1989 SW 9th St
- 409 Davis Ave
- 233 E Dunham Ave
- 221 E Dunham Ave
- 241 E Dunham Ave
- 213 E Dunham Ave
- 220 E Edison Ave
- 224 E Edison Ave
- 214 E Edison Ave
- 234 E Edison Ave
- 226 E Dunham Ave
- 234 E Dunham Ave
- 216 E Dunham Ave
- 238 E Edison Ave
- 208 E Edison Ave
- 249 E Dunham Ave
- 240 E Dunham Ave
- 212 E Dunham Ave
- 244 E Edison Ave
- 208 E Dunham Ave
- 201 E Dunham Ave
- 246 E Dunham Ave
Your Personal Tour Guide
Ask me questions while you tour the home.