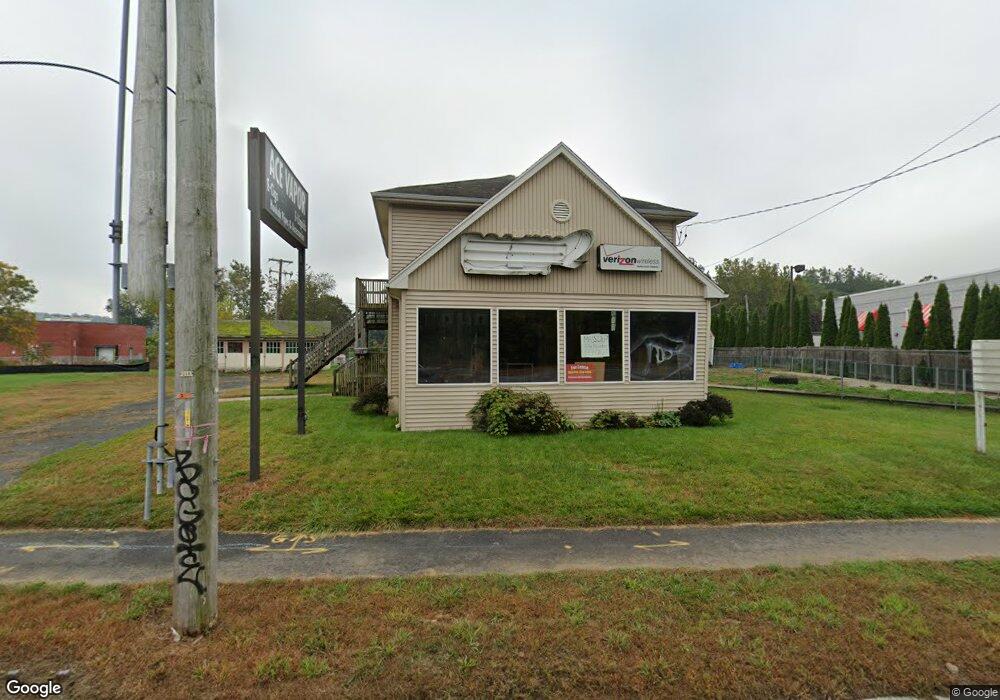
227 E Main St Westfield, MA 01085
Estimated Value: $414,699
3
Beds
3
Baths
1,736
Sq Ft
$239/Sq Ft
Est. Value
About This Home
This home is located at 227 E Main St, Westfield, MA 01085 and is currently estimated at $414,699, approximately $238 per square foot. 227 E Main St is a home located in Hampden County with nearby schools including Westfield High School and Saint Mary High School.
Ownership History
Date
Name
Owned For
Owner Type
Purchase Details
Closed on
Jul 14, 2017
Sold by
Demers Family Realty L
Bought by
Erlk Realty Llc
Current Estimated Value
Purchase Details
Closed on
Oct 27, 2004
Sold by
Leveille Joseph F
Bought by
Demers Family Rlty Llc and Demers James R
Home Financials for this Owner
Home Financials are based on the most recent Mortgage that was taken out on this home.
Original Mortgage
$436,000
Interest Rate
5.74%
Mortgage Type
Commercial
Create a Home Valuation Report for This Property
The Home Valuation Report is an in-depth analysis detailing your home's value as well as a comparison with similar homes in the area
Home Values in the Area
Average Home Value in this Area
Purchase History
| Date | Buyer | Sale Price | Title Company |
|---|---|---|---|
| Erlk Realty Llc | $245,000 | -- | |
| Demers Family Rlty Llc | $2,915,000 | -- |
Source: Public Records
Mortgage History
| Date | Status | Borrower | Loan Amount |
|---|---|---|---|
| Previous Owner | Demers Family Rlty Llc | $436,000 |
Source: Public Records
Tax History
| Year | Tax Paid | Tax Assessment Tax Assessment Total Assessment is a certain percentage of the fair market value that is determined by local assessors to be the total taxable value of land and additions on the property. | Land | Improvement |
|---|---|---|---|---|
| 2025 | $9,769 | $334,900 | $260,100 | $74,800 |
| 2024 | $9,668 | $308,000 | $236,700 | $71,300 |
| 2023 | $9,654 | $288,000 | $224,900 | $63,100 |
| 2022 | $9,444 | $260,100 | $200,500 | $59,600 |
| 2021 | $6,353 | $260,100 | $200,500 | $59,600 |
| 2020 | $2,956 | $260,100 | $200,500 | $59,600 |
| 2019 | $9,443 | $248,900 | $191,700 | $57,200 |
| 2018 | $3,654 | $305,300 | $191,700 | $113,600 |
| 2017 | $11,131 | $300,200 | $191,700 | $108,500 |
| 2016 | $11,011 | $300,200 | $191,700 | $108,500 |
| 2015 | $10,240 | $295,200 | $191,700 | $103,500 |
| 2014 | $9,990 | $295,200 | $191,700 | $103,500 |
Source: Public Records
Map
Nearby Homes
- 18 Noble St
- 2 Cycle St
- 33 George St
- 63 George St
- 61 Ridgecrest Dr
- 25 Dubois St
- 120 Woodcliff Dr
- 83 Mechanic St
- 119 Union St Unit 4
- 161 Wildflower Cir
- 103 Woodcliff Dr
- 26 Washington St
- 24 Sunflower Ln Unit B
- 13 Green Ave
- 16 Squawfield Rd
- 12 Sibley Ave
- 35 Jefferson St
- 242 Eastwood Dr
- 19 Kellogg St
- 91 Squawfield Rd
Your Personal Tour Guide
Ask me questions while you tour the home.