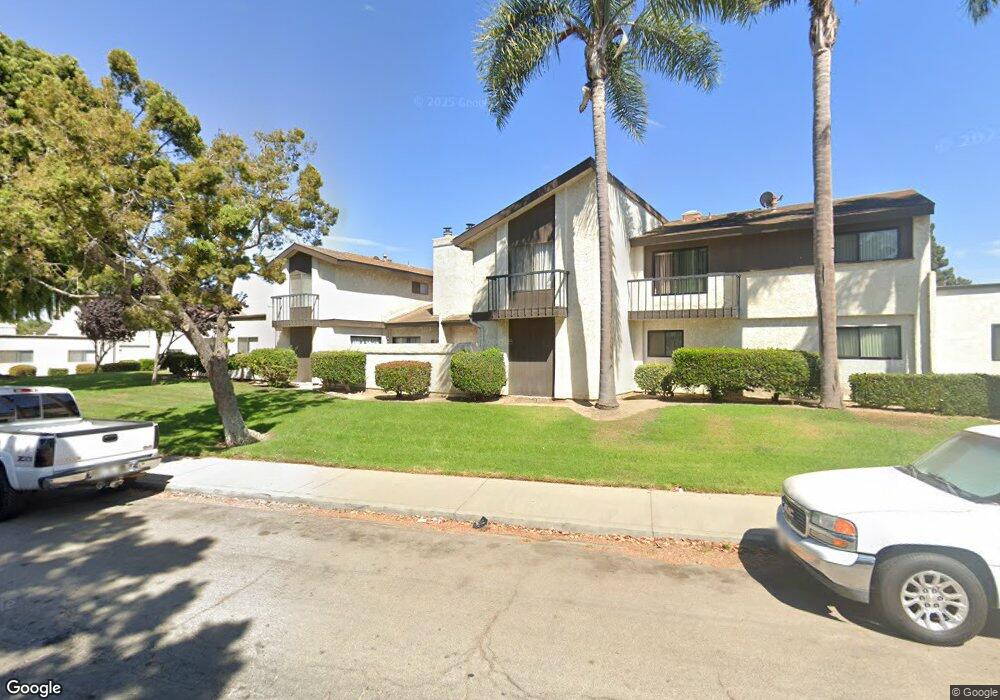
227 Marquis Place Santa Maria, CA 93454
Estimated Value: $461,000 - $467,000
3
Beds
2
Baths
1,578
Sq Ft
$295/Sq Ft
Est. Value
About This Home
This home is located at 227 Marquis Place, Santa Maria, CA 93454 and is currently estimated at $465,224, approximately $294 per square foot. 227 Marquis Place is a home located in Santa Barbara County with nearby schools including Alvin Elementary School, Fesler (Isaac) Junior High School, and Pioneer Valley High School.
Ownership History
Date
Name
Owned For
Owner Type
Purchase Details
Closed on
Aug 5, 2019
Sold by
Butterfield Stephanie and Bell Stephanie
Bought by
Doong Eugene Yungchin
Current Estimated Value
Purchase Details
Closed on
Dec 9, 2009
Sold by
Adames Renata B
Bought by
Bell Stephanie
Home Financials for this Owner
Home Financials are based on the most recent Mortgage that was taken out on this home.
Original Mortgage
$163,975
Interest Rate
4.68%
Mortgage Type
FHA
Purchase Details
Closed on
Aug 21, 2001
Sold by
Potter Robert C and Potter Pat S
Bought by
Adames Renata B
Home Financials for this Owner
Home Financials are based on the most recent Mortgage that was taken out on this home.
Original Mortgage
$146,200
Interest Rate
7.05%
Mortgage Type
Purchase Money Mortgage
Purchase Details
Closed on
Feb 22, 2001
Sold by
Simpson Robert W and Simpson Dorothy C
Bought by
Potter Robert C and Potter Pat S
Create a Home Valuation Report for This Property
The Home Valuation Report is an in-depth analysis detailing your home's value as well as a comparison with similar homes in the area
Home Values in the Area
Average Home Value in this Area
Purchase History
| Date | Buyer | Sale Price | Title Company |
|---|---|---|---|
| Doong Eugene Yungchin | $265,000 | Fidelity National Title Co | |
| Bell Stephanie | $167,000 | Fidelity National Title Co | |
| Adames Renata B | $162,500 | Stewart Title | |
| Potter Robert C | $155,000 | Lawyers Title Company |
Source: Public Records
Mortgage History
| Date | Status | Borrower | Loan Amount |
|---|---|---|---|
| Previous Owner | Bell Stephanie | $163,975 | |
| Previous Owner | Adames Renata B | $146,200 |
Source: Public Records
Tax History Compared to Growth
Tax History
| Year | Tax Paid | Tax Assessment Tax Assessment Total Assessment is a certain percentage of the fair market value that is determined by local assessors to be the total taxable value of land and additions on the property. | Land | Improvement |
|---|---|---|---|---|
| 2025 | $3,126 | $289,812 | $49,212 | $240,600 |
| 2023 | $3,126 | $278,560 | $47,302 | $231,258 |
| 2022 | $3,028 | $273,099 | $46,375 | $226,724 |
| 2021 | $2,949 | $267,745 | $45,466 | $222,279 |
| 2020 | $2,945 | $265,000 | $45,000 | $220,000 |
| 2019 | $2,182 | $193,233 | $104,138 | $89,095 |
| 2018 | $2,154 | $189,446 | $102,097 | $87,349 |
| 2017 | $2,130 | $185,733 | $100,096 | $85,637 |
| 2016 | $2,038 | $182,092 | $98,134 | $83,958 |
| 2014 | $1,914 | $175,845 | $94,767 | $81,078 |
Source: Public Records
Map
Nearby Homes
- 939 E El Camino St
- 310 El Calle Jon
- 1226 Calle de Campo
- 623 E Cook St
- 1314 Emerald Dr
- 808 Moss Ct
- 902 E Evergreen Ave
- 512 Garnet Way
- 1224 Jackie Ln
- 828 E Boone St Unit 12
- 1312 Charlotte Dr
- 226 E Tunnell St
- 715 S Bradley Rd Unit 14
- 702 E Sunset Ave
- 1504 Corinne Ct
- 1424 Sagewood Dr
- 295 N Broadway Unit 184
- 1034 Big Pine Dr
- 229 Marquis Place
- 225 Marquis Place
- 223 Marquis Place
- 233 Marquis Place
- 219 Marquis Place
- 226 Marquis Place
- 224 Marquis Place
- 222 Marquis Place
- 217 Marquis Place
- 220 Marquis Place
- 906 Queens Ct
- 910 Queens Ct
- 908 Queens Ct
- 904 Queens Ct
- 215 Marquis Place
- 845 Crown Ct
- 912 Queens Ct
- 218 Marquis Place
- 914 Queens Ct
- 843 Crown Ct