Estimated Value: $57,072 - $132,000
--
Bed
1
Bath
960
Sq Ft
$92/Sq Ft
Est. Value
About This Home
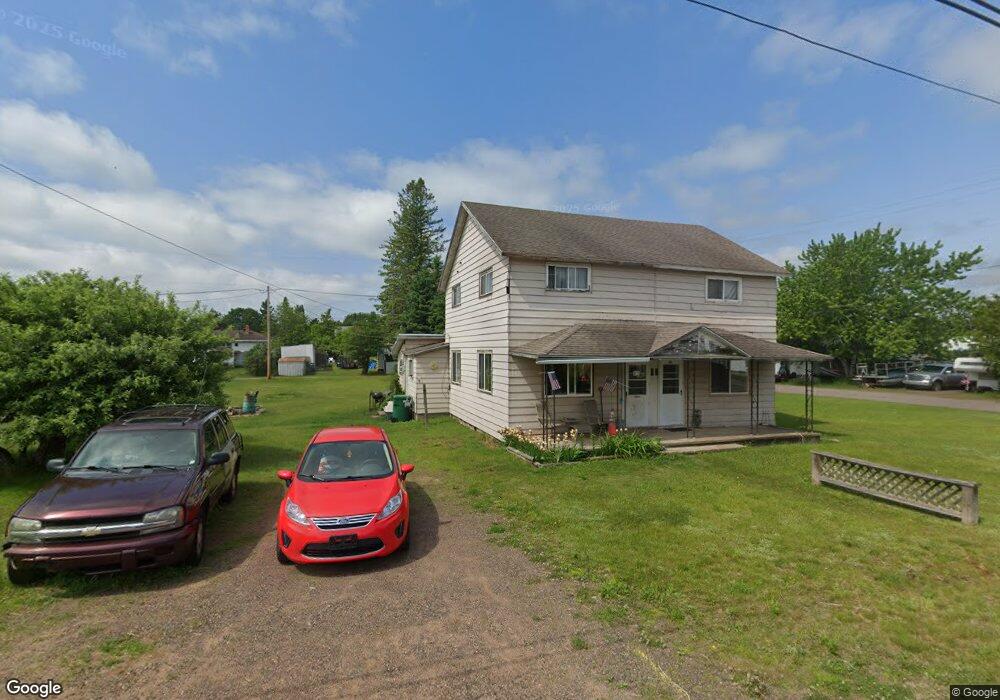
This home is located at 227 N Elm St, Gwinn, MI 49841 and is currently estimated at $88,691, approximately $92 per square foot. 227 N Elm St is a home located in Marquette County with nearby schools including K.I. Sawyer Elementary School and Gwinn Middle/High School.
Ownership History
Date
Name
Owned For
Owner Type
Purchase Details
Closed on
Jul 6, 2024
Sold by
Macdonald Chloe N and Macdonald Paige
Bought by
Beauchamp Steven G and Beauchamp Patricia L
Current Estimated Value
Home Financials for this Owner
Home Financials are based on the most recent Mortgage that was taken out on this home.
Original Mortgage
$40,000
Outstanding Balance
$36,644
Interest Rate
7.03%
Mortgage Type
New Conventional
Estimated Equity
$52,047
Purchase Details
Closed on
Nov 1, 2022
Sold by
Macdonald Danny H
Bought by
Macdonald Danny H and Macdonald Chloe N
Purchase Details
Closed on
Jan 29, 2019
Sold by
Chaput Guy R
Bought by
Delmont James C and Delmont Melissa M
Purchase Details
Closed on
Jan 3, 2019
Sold by
Orville Lacourt Iii John
Bought by
Macdonald Danny
Purchase Details
Closed on
Nov 29, 2018
Sold by
Delmont James C
Bought by
Lacourt John Orville
Create a Home Valuation Report for This Property
The Home Valuation Report is an in-depth analysis detailing your home's value as well as a comparison with similar homes in the area
Home Values in the Area
Average Home Value in this Area
Purchase History
| Date | Buyer | Sale Price | Title Company |
|---|---|---|---|
| Beauchamp Steven G | $70,000 | None Listed On Document | |
| Macdonald Danny H | -- | None Listed On Document | |
| Delmont James C | $14,500 | O Dea Nordeen Burink And Picke | |
| Macdonald Danny | $25,000 | Odea Nordeen Burink And Picken | |
| Lacourt John Orville | $8,500 | Odea Nordeen Burink And Picken |
Source: Public Records
Mortgage History
| Date | Status | Borrower | Loan Amount |
|---|---|---|---|
| Open | Beauchamp Steven G | $40,000 |
Source: Public Records
Tax History Compared to Growth
Tax History
| Year | Tax Paid | Tax Assessment Tax Assessment Total Assessment is a certain percentage of the fair market value that is determined by local assessors to be the total taxable value of land and additions on the property. | Land | Improvement |
|---|---|---|---|---|
| 2025 | $3 | $20,800 | $0 | $0 |
| 2024 | $3 | $19,100 | $0 | $0 |
| 2023 | $239 | $18,000 | $0 | $0 |
| 2022 | $746 | $14,400 | $0 | $0 |
| 2021 | $723 | $14,800 | $0 | $0 |
| 2020 | $712 | $14,400 | $0 | $0 |
| 2019 | $589 | $13,800 | $0 | $0 |
| 2018 | $834 | $11,950 | $0 | $0 |
| 2017 | $1,567 | $13,300 | $0 | $0 |
| 2016 | $689 | $13,050 | $0 | $0 |
| 2015 | -- | $13,050 | $0 | $0 |
| 2014 | -- | $13,250 | $0 | $0 |
| 2012 | -- | $14,200 | $0 | $0 |
Source: Public Records
Map
Nearby Homes
- 211 N Pine St
- 232 W Jasper St
- 258 W Jasper St
- Section 33 E State Highway M35
- 116 E State Highway M35
- 158 N Pine St
- 149 N Spruce St
- 337 N Adams St W
- TBD Ln
- 55 E Riling St Unit Lot 82
- 148 E Sands St
- 171 E Sands St
- Parcel 3 Iron Pin Trail
- Parcel 1 Iron Pin Trail
- 1.38A E Johnson Lake Rd
- Parcel 4 Off Johnson Lake Rd
- Parcel 7 Off Johnson Lake Rd
- Parcel 6 Off Johnson Lake Rd
- Parcel 8 Off Johnson Lake Rd
- 192 Johnson Lake Rd