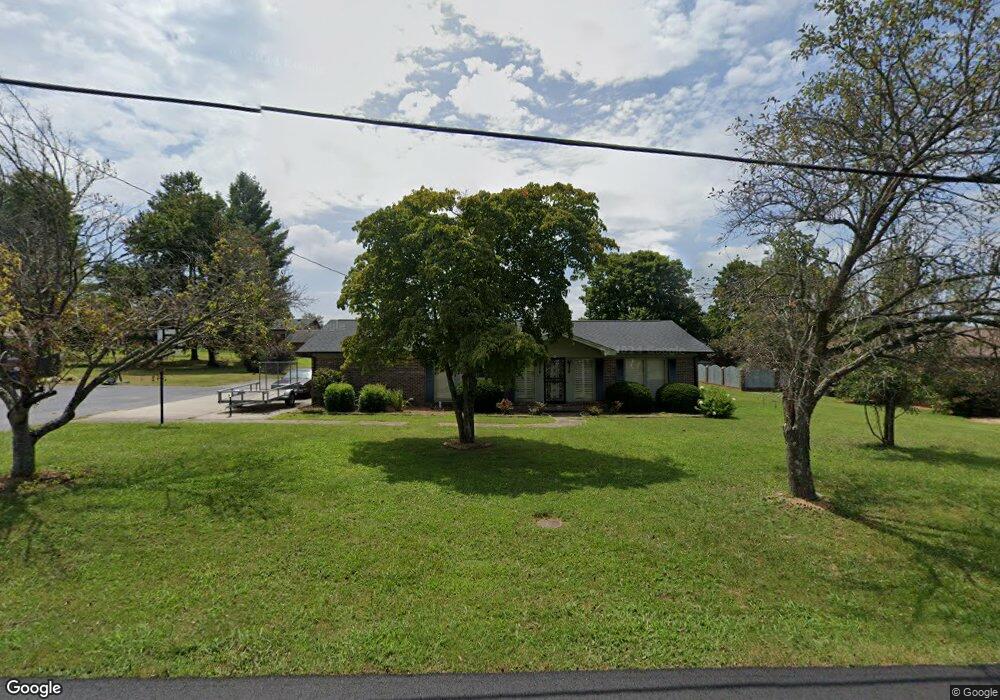
227 Oakland Dr Sparta, TN 38583
Estimated Value: $218,322 - $365,000
3
Beds
2
Baths
1,540
Sq Ft
$199/Sq Ft
Est. Value
About This Home
This home is located at 227 Oakland Dr, Sparta, TN 38583 and is currently estimated at $305,831, approximately $198 per square foot. 227 Oakland Dr is a home located in White County with nearby schools including Findlay Elementary School, White County Middle School, and White County High School.
Ownership History
Date
Name
Owned For
Owner Type
Purchase Details
Closed on
Apr 10, 2025
Sold by
Neang Meng
Bought by
Chea Lina
Current Estimated Value
Purchase Details
Closed on
Jul 8, 2015
Sold by
Sparkman Willie Mae
Bought by
Neang Meng
Purchase Details
Closed on
Jan 30, 2009
Sold by
Griffin David Michael
Bought by
Sparkman Willie Mae
Home Financials for this Owner
Home Financials are based on the most recent Mortgage that was taken out on this home.
Original Mortgage
$100,000
Interest Rate
5.08%
Purchase Details
Closed on
Apr 21, 1994
Sold by
Gamel Eskander
Bought by
David Griffin
Purchase Details
Closed on
May 8, 1991
Bought by
Eskander Gamel S and Eskander Karen K
Purchase Details
Closed on
Oct 2, 1987
Bought by
Sapp Kenneth L & Luanna & Bank Of Putnam
Purchase Details
Closed on
Jan 3, 1900
Purchase Details
Closed on
Jan 2, 1900
Create a Home Valuation Report for This Property
The Home Valuation Report is an in-depth analysis detailing your home's value as well as a comparison with similar homes in the area
Home Values in the Area
Average Home Value in this Area
Purchase History
| Date | Buyer | Sale Price | Title Company |
|---|---|---|---|
| Chea Lina | -- | None Listed On Document | |
| Chea Lina | -- | None Listed On Document | |
| Neang Meng | $133,000 | -- | |
| Sparkman Willie Mae | $125,000 | -- | |
| David Griffin | $76,000 | -- | |
| Eskander Gamel S | $70,500 | -- | |
| Sapp Kenneth L & Luanna & Bank Of Putnam | -- | -- | |
| -- | -- | -- | |
| -- | -- | -- |
Source: Public Records
Mortgage History
| Date | Status | Borrower | Loan Amount |
|---|---|---|---|
| Previous Owner | Not Available | $100,000 |
Source: Public Records
Tax History Compared to Growth
Tax History
| Year | Tax Paid | Tax Assessment Tax Assessment Total Assessment is a certain percentage of the fair market value that is determined by local assessors to be the total taxable value of land and additions on the property. | Land | Improvement |
|---|---|---|---|---|
| 2025 | -- | $67,750 | $0 | $0 |
| 2024 | -- | $34,275 | $5,000 | $29,275 |
| 2023 | $703 | $34,275 | $5,000 | $29,275 |
| 2022 | $1,018 | $34,275 | $5,000 | $29,275 |
| 2021 | $1,017 | $34,275 | $5,000 | $29,275 |
| 2020 | $1,018 | $34,275 | $5,000 | $29,275 |
| 2019 | $912 | $29,400 | $3,750 | $25,650 |
| 2018 | $912 | $29,400 | $3,750 | $25,650 |
| 2017 | $912 | $29,400 | $3,750 | $25,650 |
| 2016 | $912 | $29,400 | $3,750 | $25,650 |
| 2015 | $853 | $29,400 | $3,750 | $25,650 |
| 2014 | -- | $29,400 | $3,750 | $25,650 |
| 2013 | -- | $28,525 | $3,750 | $24,775 |
Source: Public Records
Map
Nearby Homes
- 210 Gillen Dr
- 202 Gillen Dr
- 249 N Spring St
- 0 Moore St
- 23 Acres Moore St
- 23 AC Moore St
- 113 N Spring St
- 147 Sunrise Ridge Dr
- 301 W Everett St
- 21 Ac N Spring St
- 0 N Main St
- 244 W Bockman Way
- 25 Mayberry St
- 548 Turntable Rd
- 548 Turn Table Rd
- 112 N Church St
- 105 N Church St
- 107 N Main St
- 7 Marshall St
- 18 N Church St
- 223 Oakland Dr
- 229 Oakland Dr
- 229 229 Oakland Dr
- 31 Clearwater Sq Lot 31
- 224 Gillen Dr
- 222 Gillen Dr
- 0 Gillen Dr
- 226 Gillen Dr
- 230 Oakland Dr
- 226 Oakland Dr
- 219 Oakland Dr
- 220 Gillen Dr
- 234 Oakland Dr
- 222 Oakland Dr
- 218 Oakland Dr
- 214 Gillen Dr
- 230 Gillen Dr
- 237 Oakland Dr
- 211 Oakland Dr
- 219 Gillen Dr