227 Redner St Lansing, MI 48911
Southern Lansing NeighborhoodEstimated Value: $150,000 - $177,000
About This Home
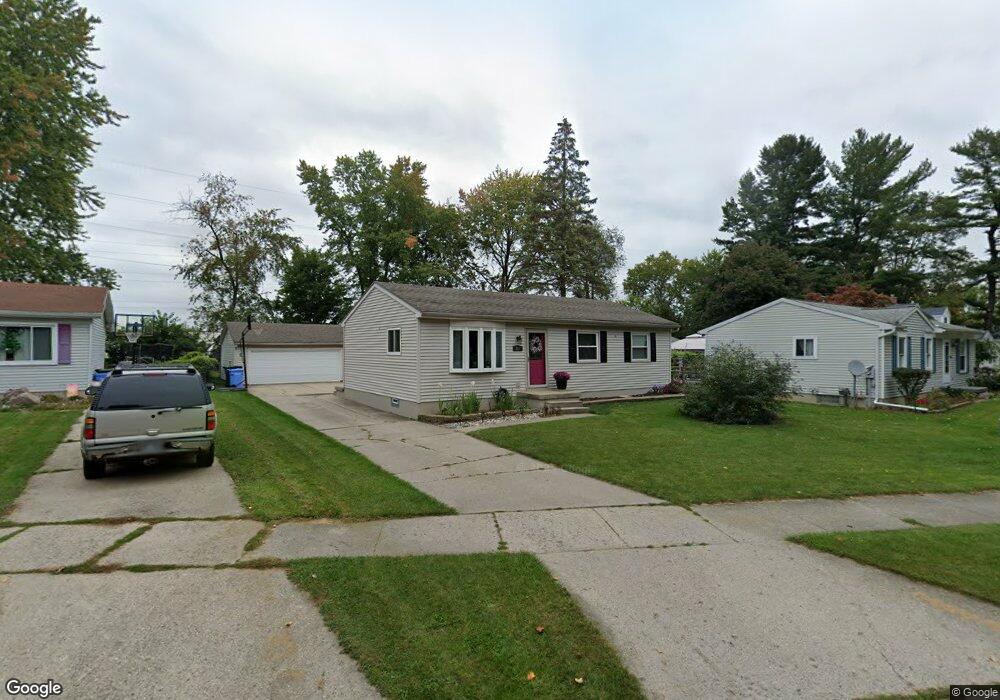
This home is located at 227 Redner St, Lansing, MI 48911 and is currently estimated at $164,356, approximately $171 per square foot. 227 Redner St is a home located in Ingham County with nearby schools including Kendon School, Attwood School, and Everett High School.
Ownership History
We collect this data history from publicly available records. To have your information removed, we recommend requesting removal directly through your county’s website.
Purchase Details
Purchase Details
Home Financials for this Owner
Home Financials are based on the most recent Mortgage that was taken out on this home.Home Values in the Area
Average Home Value in this Area
Purchase History
We collect this data history from publicly available records. To have your information removed, we recommend requesting removal directly through your county’s website.
| Date | Buyer | Sale Price | Title Company |
|---|---|---|---|
| $120,507 | None Available | ||
| $94,900 | First American Title Ins Co |
Mortgage History
We collect this data history from publicly available records. To have your information removed, we recommend requesting removal directly through your county’s website.
| Date | Status | Borrower | Loan Amount |
|---|---|---|---|
| Previous Owner | $94,387 |
Tax History
We collect this data history from publicly available records. To have your information removed, we recommend requesting removal directly through your county’s website.
| Year | Tax Paid | Tax Assessment Tax Assessment Total Assessment is a certain percentage of the fair market value that is determined by local assessors to be the total taxable value of land and additions on the property. | Land | Improvement |
|---|---|---|---|---|
| 2025 | $2,421 | $74,100 | $12,300 | $61,800 |
| 2024 | $23 | $66,200 | $12,300 | $53,900 |
| 2023 | $2,782 | $62,600 | $12,300 | $50,300 |
| 2022 | $2,508 | $55,700 | $10,600 | $45,100 |
| 2021 | $2,456 | $52,800 | $8,800 | $44,000 |
| 2020 | $2,441 | $50,200 | $8,800 | $41,400 |
| 2019 | $2,340 | $47,100 | $8,800 | $38,300 |
| 2018 | $2,193 | $43,100 | $8,800 | $34,300 |
| 2017 | $2,099 | $43,100 | $8,800 | $34,300 |
| 2016 | $2,022 | $38,000 | $8,800 | $29,200 |
| 2015 | $2,022 | $36,100 | $17,616 | $18,484 |
| 2014 | $2,022 | $35,800 | $25,367 | $10,433 |
Map
- 5635 Ellendale Dr
- 205 E Jolly Rd Unit 6
- 5700 Orchard Ct
- 5309 Granger Dr
- 5008 Southgate Ave
- 500 W Jolly Rd
- 205 Cox Blvd
- 809 W Northrup St
- 630 Julia St
- 4901 Lowcroft Ave
- 826 R G Curtiss Ave
- 4500 Donald St
- 901 Brad St
- 1006 Attwood Dr
- 833 Hein Ave
- 1001 Ferley St
- 5211 Bogart St
- 6307 Gardenia Ave
- 306 E Cavanaugh Rd
- 4812 Delbrook Ave
- 238 Trinity Cir
- 234 Trinity Cir
- 308 Redner St
- 230 Trinity Cir
- 314 Redner St
- 301 Redner St
- 307 Redner St
- 226 Trinity Cir
- 231 Redner St
- 228 Trinity Cir
- 320 Redner St
- 311 Redner St
- 218 Redner St
- 301 E Northrup St
- 221 E Northrup St
- 319 Redner St
- 221 Redner St
- 315 E Northrup St
- 328 Redner St
- 208 Redner St
Ask me questions while you tour the home.