301 Redner St Lansing, MI 48911
Southern Lansing NeighborhoodEstimated Value: $137,000 - $206,000
About This Home
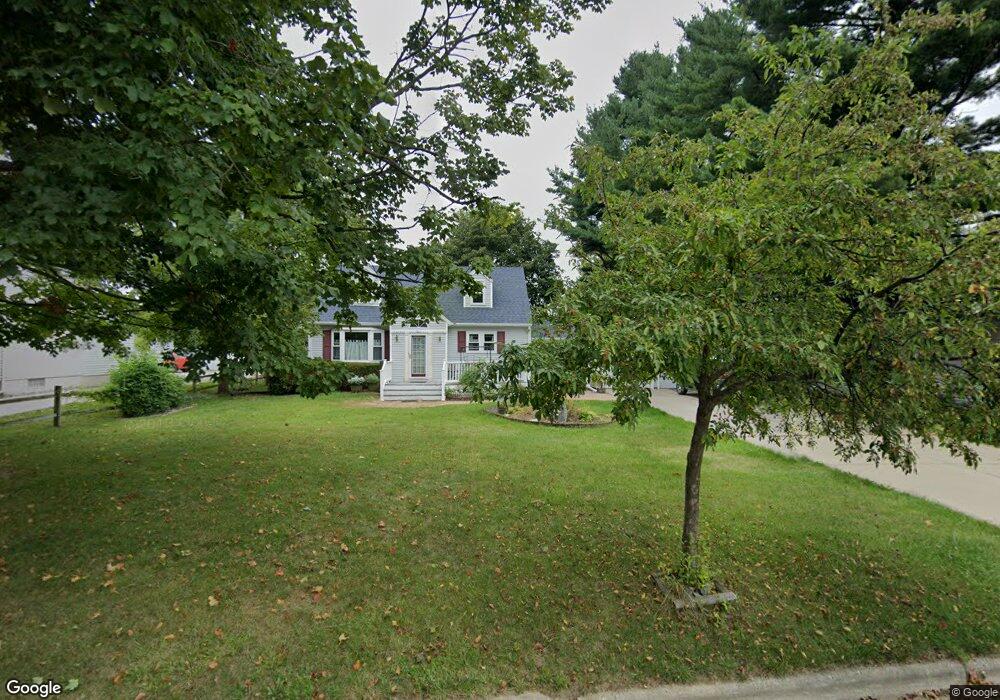
This home is located at 301 Redner St, Lansing, MI 48911 and is currently estimated at $172,410, approximately $82 per square foot. 301 Redner St is a home located in Ingham County with nearby schools including Kendon School, Attwood School, and Everett High School.
Ownership History
We collect this data history from publicly available records. To have your information removed, we recommend requesting removal directly through your county’s website.
Purchase Details
Purchase Details
Purchase Details
Home Financials for this Owner
Home Financials are based on the most recent Mortgage that was taken out on this home.Purchase Details
Purchase Details
Home Values in the Area
Average Home Value in this Area
Purchase History
We collect this data history from publicly available records. To have your information removed, we recommend requesting removal directly through your county’s website.
| Date | Buyer | Sale Price | Title Company |
|---|---|---|---|
| -- | None Available | ||
| -- | None Available | ||
| $125,500 | Tri County Title Agency Llc | ||
| -- | None Available | ||
| -- | -- |
Mortgage History
We collect this data history from publicly available records. To have your information removed, we recommend requesting removal directly through your county’s website.
| Date | Status | Borrower | Loan Amount |
|---|---|---|---|
| Open | $119,225 |
Tax History
We collect this data history from publicly available records. To have your information removed, we recommend requesting removal directly through your county’s website.
| Year | Tax Paid | Tax Assessment Tax Assessment Total Assessment is a certain percentage of the fair market value that is determined by local assessors to be the total taxable value of land and additions on the property. | Land | Improvement |
|---|---|---|---|---|
| 2025 | $2,851 | $83,100 | $14,400 | $68,700 |
| 2024 | $28 | $72,000 | $14,400 | $57,600 |
| 2023 | $3,253 | $65,900 | $14,400 | $51,500 |
| 2022 | $2,932 | $62,700 | $17,300 | $45,400 |
| 2021 | $2,871 | $59,700 | $14,400 | $45,300 |
| 2020 | $2,853 | $55,900 | $14,400 | $41,500 |
| 2019 | $2,736 | $51,900 | $14,400 | $37,500 |
| 2018 | $2,563 | $46,000 | $14,400 | $31,600 |
| 2017 | $2,454 | $46,000 | $14,400 | $31,600 |
| 2016 | $2,426 | $43,500 | $14,400 | $29,100 |
| 2015 | $2,426 | $42,500 | $28,821 | $13,679 |
| 2014 | $2,426 | $43,300 | $34,585 | $8,715 |
Map
- 205 E Jolly Rd Unit 6
- 216 W Jolly Rd
- 5700 Orchard Ct
- 5008 Southgate Ave
- 5309 Granger Dr
- 500 W Jolly Rd
- 6001 Joshua St
- 326 E Potter Ave
- 5612 S Washington Ave
- 809 W Northrup St
- 630 Julia St
- 4901 Lowcroft Ave
- 4500 Donald St
- 826 R G Curtiss Ave
- 901 Brad St
- 306 E Cavanaugh Rd
- 4820 Burchfield Ave
- 5211 Bogart St
- 1001 Ferley St
- 1006 Attwood Dr
Ask me questions while you tour the home.