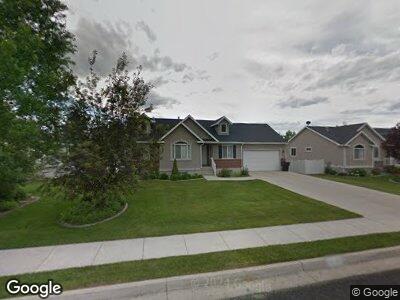
227 S 375 W Providence, UT 84332
Estimated Value: $490,185 - $522,000
3
Beds
2
Baths
2,735
Sq Ft
$185/Sq Ft
Est. Value
About This Home
This home is located at 227 S 375 W, Providence, UT 84332 and is currently estimated at $505,796, approximately $184 per square foot. 227 S 375 W is a home located in Cache County with nearby schools including River Heights School, Spring Creek Middle School, and South Cache Middle School.
Ownership History
Date
Name
Owned For
Owner Type
Purchase Details
Closed on
May 29, 2002
Sold by
Vedina Olga
Bought by
Vedina Olga and Vedina Anna
Current Estimated Value
Home Financials for this Owner
Home Financials are based on the most recent Mortgage that was taken out on this home.
Original Mortgage
$128,000
Outstanding Balance
$58,798
Interest Rate
7.08%
Estimated Equity
$448,016
Purchase Details
Closed on
Apr 29, 2002
Sold by
Jaren Taylor Construction Inc
Bought by
Vedina Olga
Home Financials for this Owner
Home Financials are based on the most recent Mortgage that was taken out on this home.
Original Mortgage
$128,000
Outstanding Balance
$58,798
Interest Rate
7.08%
Estimated Equity
$448,016
Purchase Details
Closed on
Mar 2, 2001
Sold by
Foxridge Development Co
Bought by
Jaren Taylor Construction Inc
Create a Home Valuation Report for This Property
The Home Valuation Report is an in-depth analysis detailing your home's value as well as a comparison with similar homes in the area
Home Values in the Area
Average Home Value in this Area
Purchase History
| Date | Buyer | Sale Price | Title Company |
|---|---|---|---|
| Vedina Olga | -- | Cache Title Company Inc | |
| Vedina Olga | -- | Cache Title Company | |
| Jaren Taylor Construction Inc | -- | Cache Title Company |
Source: Public Records
Mortgage History
| Date | Status | Borrower | Loan Amount |
|---|---|---|---|
| Open | Vedina Olga | $128,000 |
Source: Public Records
Tax History Compared to Growth
Tax History
| Year | Tax Paid | Tax Assessment Tax Assessment Total Assessment is a certain percentage of the fair market value that is determined by local assessors to be the total taxable value of land and additions on the property. | Land | Improvement |
|---|---|---|---|---|
| 2024 | $212 | $277,080 | $0 | $0 |
| 2023 | $2,236 | $274,780 | $0 | $0 |
| 2022 | $2,036 | $236,280 | $0 | $0 |
| 2021 | $2,000 | $355,680 | $60,000 | $295,680 |
| 2020 | $1,625 | $268,093 | $60,000 | $208,093 |
| 2019 | $1,717 | $268,092 | $60,000 | $208,092 |
| 2018 | $1,511 | $240,950 | $60,000 | $180,950 |
| 2017 | $1,398 | $117,975 | $0 | $0 |
| 2016 | $1,413 | $117,975 | $0 | $0 |
| 2015 | $1,354 | $112,720 | $0 | $0 |
| 2014 | $1,321 | $112,720 | $0 | $0 |
| 2013 | -- | $112,720 | $0 | $0 |
Source: Public Records
Map
Nearby Homes
- 600 W 300 S
- 314 W 100 S
- 463 W 60 S Unit M204
- 475 W 60 S Unit 303
- 46 S 410 W
- 460 W 15 S Unit G101
- 460 W 15 S Unit G301
- 472 W 40 S Unit 201
- 473 W 40 S Unit 204
- 437 S 580 W
- 447 S 580 W
- 1246 W 575 S Unit 154
- 196 W 100 N
- 525 S 75 W
- 465 S Main St
- 128 W 1309 S
- 1612 Talon Dr
- 374 N 100 W
- 148 E 200 S
- 150 E 200 S