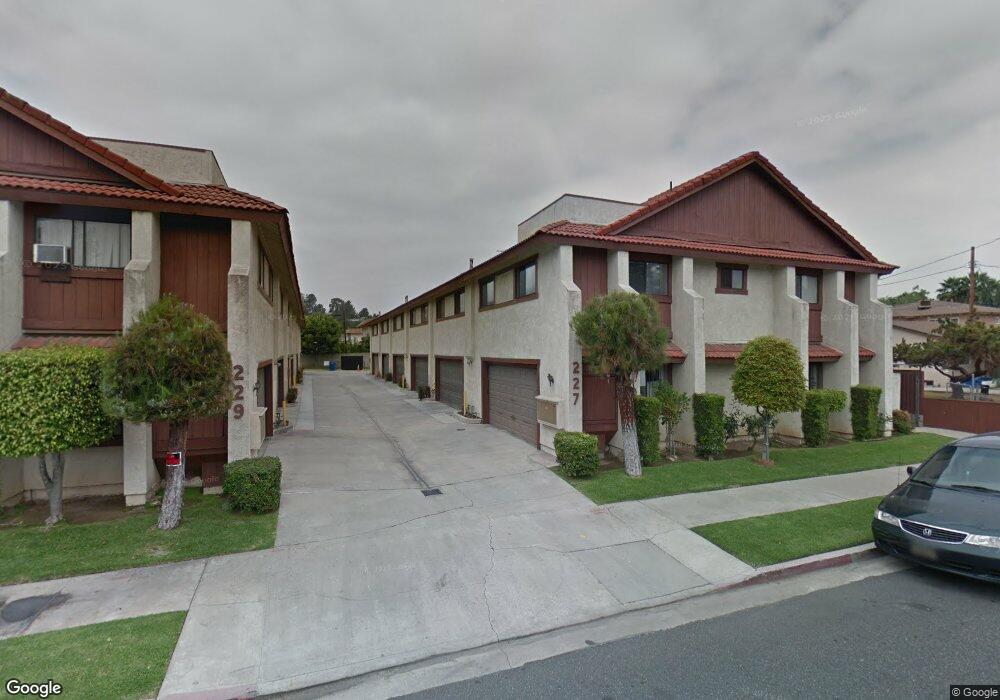
227 S Ynez Ave Unit A Monterey Park, CA 91754
Estimated Value: $644,000 - $745,000
3
Beds
3
Baths
1,186
Sq Ft
$573/Sq Ft
Est. Value
About This Home
This home is located at 227 S Ynez Ave Unit A, Monterey Park, CA 91754 and is currently estimated at $679,160, approximately $572 per square foot. 227 S Ynez Ave Unit A is a home located in Los Angeles County with nearby schools including Ynez Elementary School, Mark Keppel High School, and St. Stephen Martyr School.
Ownership History
Date
Name
Owned For
Owner Type
Purchase Details
Closed on
Mar 6, 2012
Sold by
Lee Yueh Kuei Huang and Lee Jennie S
Bought by
Lee Jennie S and Lee John W
Current Estimated Value
Purchase Details
Closed on
Jul 6, 2004
Sold by
Lee Yueh Kuei Huang
Bought by
Lee Yueh Kuei Huang and Lee Jennie S
Purchase Details
Closed on
Apr 19, 2001
Sold by
Kwan Timothy and Kwan Eileen Tamiko
Bought by
Huang Lee Yueh Kuei
Home Financials for this Owner
Home Financials are based on the most recent Mortgage that was taken out on this home.
Original Mortgage
$100,000
Interest Rate
7.03%
Purchase Details
Closed on
Apr 25, 1998
Sold by
Kwan Roland and Kwan Timothy
Bought by
Kwan Timothy and Matsushita Eileen Tamiko
Home Financials for this Owner
Home Financials are based on the most recent Mortgage that was taken out on this home.
Original Mortgage
$100,000
Interest Rate
7.06%
Create a Home Valuation Report for This Property
The Home Valuation Report is an in-depth analysis detailing your home's value as well as a comparison with similar homes in the area
Home Values in the Area
Average Home Value in this Area
Purchase History
| Date | Buyer | Sale Price | Title Company |
|---|---|---|---|
| Lee Jennie S | -- | None Available | |
| Lee Yueh Kuei Huang | -- | Ticor Title Co Glendale | |
| Huang Lee Yueh Kuei | $180,000 | American Title Co | |
| Kwan Timothy | -- | North American Title |
Source: Public Records
Mortgage History
| Date | Status | Borrower | Loan Amount |
|---|---|---|---|
| Closed | Huang Lee Yueh Kuei | $100,000 | |
| Previous Owner | Kwan Timothy | $100,000 |
Source: Public Records
Tax History Compared to Growth
Tax History
| Year | Tax Paid | Tax Assessment Tax Assessment Total Assessment is a certain percentage of the fair market value that is determined by local assessors to be the total taxable value of land and additions on the property. | Land | Improvement |
|---|---|---|---|---|
| 2025 | $3,613 | $271,209 | $116,015 | $155,194 |
| 2024 | $3,613 | $265,892 | $113,741 | $152,151 |
| 2023 | $3,538 | $260,679 | $111,511 | $149,168 |
| 2022 | $3,373 | $255,569 | $109,325 | $146,244 |
| 2021 | $3,327 | $250,559 | $107,182 | $143,377 |
| 2019 | $3,209 | $243,128 | $104,003 | $139,125 |
| 2018 | $3,197 | $238,362 | $101,964 | $136,398 |
| 2016 | $2,963 | $229,107 | $98,005 | $131,102 |
| 2015 | $2,916 | $225,666 | $96,533 | $129,133 |
| 2014 | $2,879 | $221,247 | $94,643 | $126,604 |
Source: Public Records
Map
Nearby Homes
- 125 S Moore Ave Unit 2
- 419 S Chandler Ave Unit 521
- 421 S Garfield Ave Unit 79
- 408 De la Fuente St
- 411 S Garfield Ave
- 311 Montechico Dr
- 215 W Garcelon Ave
- 513 W Emerson Ave Unit C
- 402 N Ynez Ave
- 438 S Garfield Ave Unit E
- 305 N Baltimore Ave Unit C
- 419 N Chandler Ave Unit 508
- 419 N Chandler Ave Unit 305
- 419 N Chandler Ave Unit 413
- 419 N Chandler Ave Unit 319
- 419 N Chandler Ave Unit 310
- 419 N Chandler Ave Unit 311
- 419 N Chandler Ave Unit 308
- 0 Garvey Ave Unit MB21123625
- 516 N Moore Ave Unit A
- 227 S Ynez Ave Unit F
- 227 S Ynez Ave Unit E
- 227 S Ynez Ave Unit D
- 227 S Ynez Ave Unit C
- 229 S Ynez Ave Unit E
- 229 S Ynez Ave Unit D
- 229 S Ynez Ave Unit C
- 229 S Ynez Ave Unit B
- 229 S Ynez Ave Unit A
- 229 S Ynez Ave Unit G
- 229 S Ynez Ave Unit F
- 223 S Ynez Ave
- 505 W Newmark Ave Unit A
- 215 S Ynez Ave
- 515 W Newmark Ave
- 501 W Newmark Ave
- 519 W Newmark Ave
- 226 S Moore Ave
- 222 S Moore Ave
- 218 S Moore Ave