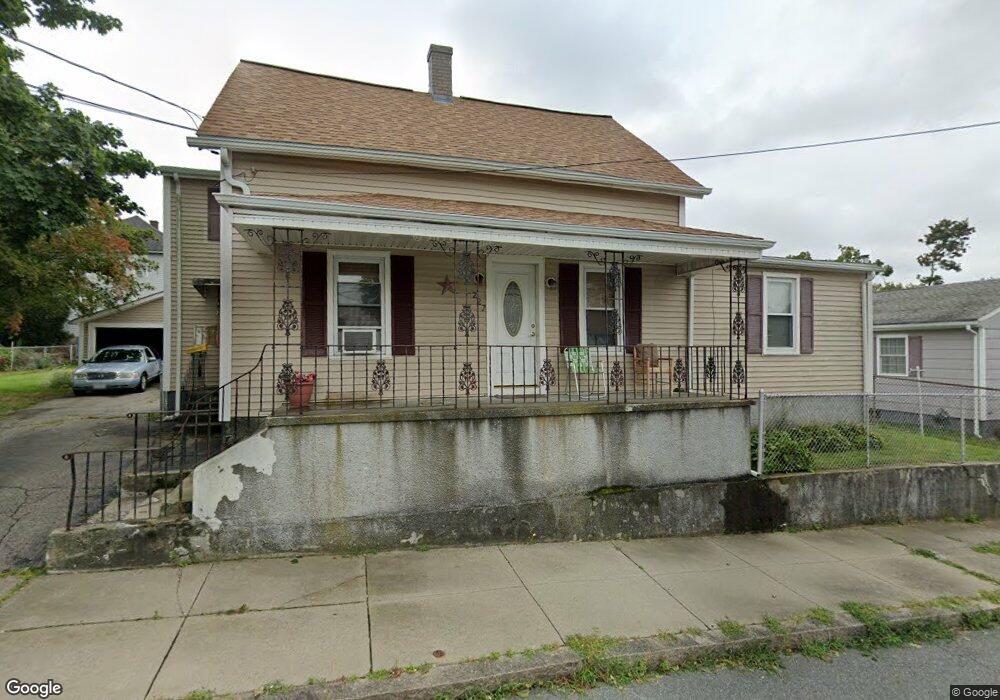
227 Slade St Fall River, MA 02724
Sandy Beach NeighborhoodEstimated Value: $421,386 - $513,000
4
Beds
2
Baths
1,357
Sq Ft
$335/Sq Ft
Est. Value
About This Home
This home is located at 227 Slade St, Fall River, MA 02724 and is currently estimated at $454,347, approximately $334 per square foot. 227 Slade St is a home located in Bristol County with nearby schools including Carlton M. Viveiros Elementary School, Matthew J. Kuss Middle School, and B M C Durfee High School.
Ownership History
Date
Name
Owned For
Owner Type
Purchase Details
Closed on
Apr 27, 1998
Sold by
Pare Cheryl A
Bought by
Ferreira Robert J and Ferreira Dorothy L
Current Estimated Value
Home Financials for this Owner
Home Financials are based on the most recent Mortgage that was taken out on this home.
Original Mortgage
$122,000
Interest Rate
7.11%
Mortgage Type
Purchase Money Mortgage
Purchase Details
Closed on
Jun 28, 1990
Sold by
Pare Louise
Bought by
Pare Kevin M
Create a Home Valuation Report for This Property
The Home Valuation Report is an in-depth analysis detailing your home's value as well as a comparison with similar homes in the area
Home Values in the Area
Average Home Value in this Area
Purchase History
We collect this data history from publicly available records. To have your information removed, we recommend requesting removal directly through your county’s website.
| Date | Buyer | Sale Price | Title Company |
|---|---|---|---|
| Ferreira Robert J | $122,000 | -- | |
| Pare Kevin M | $108,000 | -- | |
| Pare Kevin M | $108,000 | -- |
Source: Public Records
Mortgage History
We collect this data history from publicly available records. To have your information removed, we recommend requesting removal directly through your county’s website.
| Date | Status | Borrower | Loan Amount |
|---|---|---|---|
| Open | Pare Kevin M | $236,600 | |
| Closed | Pare Kevin M | $173,650 | |
| Closed | Pare Kevin M | $122,000 |
Source: Public Records
Tax History
| Year | Tax Paid | Tax Assessment Tax Assessment Total Assessment is a certain percentage of the fair market value that is determined by local assessors to be the total taxable value of land and additions on the property. | Land | Improvement |
|---|---|---|---|---|
| 2025 | $4,530 | $395,600 | $130,200 | $265,400 |
| 2024 | $4,186 | $364,300 | $125,200 | $239,100 |
| 2023 | $3,838 | $312,800 | $107,400 | $205,400 |
| 2022 | $3,541 | $280,600 | $97,600 | $183,000 |
| 2021 | $3,304 | $238,900 | $90,300 | $148,600 |
| 2020 | $3,001 | $207,700 | $86,400 | $121,300 |
| 2019 | $2,856 | $195,900 | $82,300 | $113,600 |
| 2018 | $2,668 | $182,500 | $80,800 | $101,700 |
| 2017 | $2,510 | $179,300 | $82,400 | $96,900 |
| 2016 | $2,463 | $180,700 | $85,800 | $94,900 |
| 2015 | $2,324 | $177,700 | $82,700 | $95,000 |
| 2014 | $2,379 | $189,100 | $87,000 | $102,100 |
Source: Public Records
Map
Nearby Homes
Your Personal Tour Guide
Ask me questions while you tour the home.