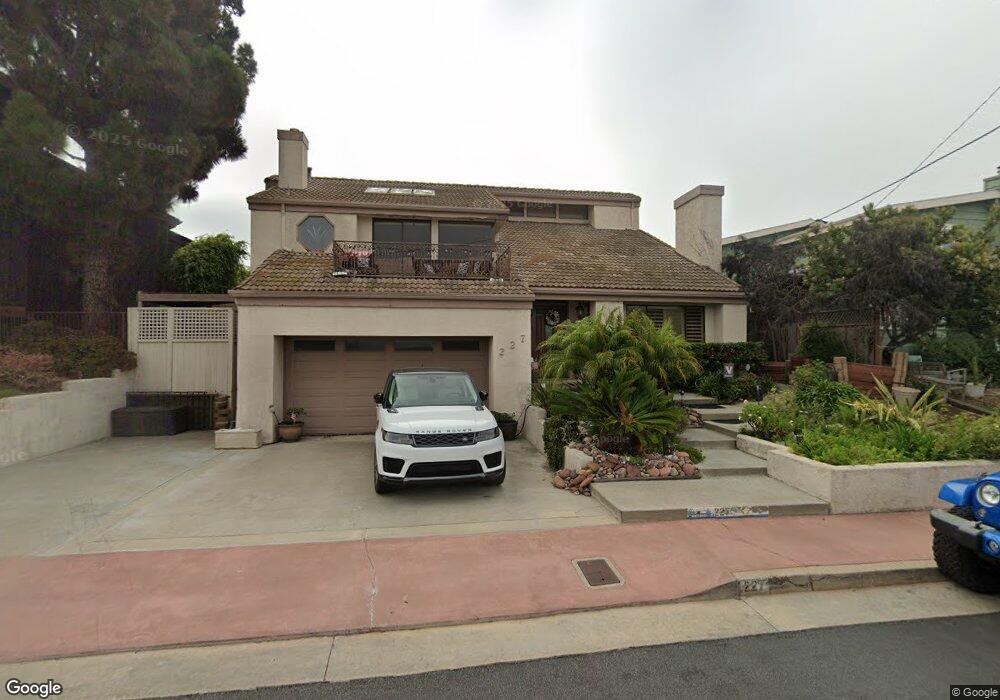
227 Trafalgar Ln San Clemente, CA 92672
Southwest San Clemente NeighborhoodEstimated Value: $2,404,660 - $3,566,000
3
Beds
3
Baths
2,731
Sq Ft
$1,099/Sq Ft
Est. Value
About This Home
This home is located at 227 Trafalgar Ln, San Clemente, CA 92672 and is currently estimated at $3,001,165, approximately $1,098 per square foot. 227 Trafalgar Ln is a home located in Orange County with nearby schools including Concordia Elementary School, Shorecliffs Middle School, and San Clemente High School.
Ownership History
Date
Name
Owned For
Owner Type
Purchase Details
Closed on
Mar 31, 2022
Sold by
Ziomek John J and Ziomek Heidi E
Bought by
John & Heidi Ziomek Family Trust
Current Estimated Value
Home Financials for this Owner
Home Financials are based on the most recent Mortgage that was taken out on this home.
Original Mortgage
$647,200
Outstanding Balance
$530,589
Interest Rate
3.83%
Mortgage Type
New Conventional
Estimated Equity
$2,470,576
Purchase Details
Closed on
Jan 22, 2010
Sold by
Ziomek John J and Ziomek Heidi E
Bought by
Ziomek John and Ziomek Heidi
Purchase Details
Closed on
Aug 30, 1997
Sold by
Lacy William J and Lacy Elizabeth D
Bought by
Ziomek John J and Ziomek Heidi E
Home Financials for this Owner
Home Financials are based on the most recent Mortgage that was taken out on this home.
Original Mortgage
$368,000
Interest Rate
7.3%
Purchase Details
Closed on
Nov 26, 1996
Sold by
Elizabeth Lacy D
Bought by
Lacy William J
Create a Home Valuation Report for This Property
The Home Valuation Report is an in-depth analysis detailing your home's value as well as a comparison with similar homes in the area
Home Values in the Area
Average Home Value in this Area
Purchase History
| Date | Buyer | Sale Price | Title Company |
|---|---|---|---|
| John & Heidi Ziomek Family Trust | -- | Title Connect | |
| Ziomek John J | -- | Title Connect | |
| Ziomek John | -- | None Available | |
| Ziomek John J | $460,000 | First Southwestern Title Co | |
| Lacy William J | -- | -- |
Source: Public Records
Mortgage History
| Date | Status | Borrower | Loan Amount |
|---|---|---|---|
| Open | Ziomek John J | $647,200 | |
| Closed | John & Heidi Ziomek Family Trust | $647,200 | |
| Previous Owner | Ziomek John J | $368,000 | |
| Closed | Ziomek John J | $69,000 |
Source: Public Records
Tax History Compared to Growth
Tax History
| Year | Tax Paid | Tax Assessment Tax Assessment Total Assessment is a certain percentage of the fair market value that is determined by local assessors to be the total taxable value of land and additions on the property. | Land | Improvement |
|---|---|---|---|---|
| 2025 | $7,235 | $734,499 | $435,853 | $298,646 |
| 2024 | $7,235 | $720,098 | $427,307 | $292,791 |
| 2023 | $7,081 | $705,979 | $418,929 | $287,050 |
| 2022 | $6,945 | $692,137 | $410,715 | $281,422 |
| 2021 | $6,809 | $678,566 | $402,662 | $275,904 |
| 2020 | $6,741 | $671,609 | $398,534 | $273,075 |
| 2019 | $10,316 | $658,441 | $390,720 | $267,721 |
| 2018 | $10,183 | $645,531 | $383,059 | $262,472 |
| 2017 | $10,035 | $632,874 | $375,548 | $257,326 |
| 2016 | $9,913 | $620,465 | $368,184 | $252,281 |
| 2015 | $6,133 | $611,146 | $362,654 | $248,492 |
| 2014 | $6,014 | $599,175 | $355,550 | $243,625 |
Source: Public Records
Map
Nearby Homes
- 217 Vista Marina
- 501 Elena Ln Unit B
- 117 Santa Ana Ln Unit A
- 229 W Paseo de Cristobal
- 420 Monterey Ln Unit R16
- 144 Esplanade
- 251 Avenida Madrid
- 147 Trafalgar Ln
- 243 Avenida Madrid
- 229 W Avenida Cordoba
- 405 Avenida Granada Unit 212
- 405 Avenida Granada Unit 202
- 210 W Avenida Gaviota
- 229 Avenida Monterey Unit B
- 229 Avenida Monterey Unit A
- 221 Avenida Monterey
- 251 Avenida Del Mar
- 423 Avenida Granada Unit 54
- 306 Avenida Cabrillo
- 309 W Avenida Palizada
- 229 Trafalgar Ln
- 225 Trafalgar Ln
- 231 Trafalgar Ln
- 224 Avenida Barcelona
- 223 Trafalgar Ln
- 226 Avenida Barcelona
- 222 Avenida Barcelona
- 220 Avenida Barcelona
- 221 Trafalgar Ln
- 236 Esplanade
- 226 Trafalgar Ln
- 228 Trafalgar Ln
- 228 Avenida Barcelona
- 238 Esplanade
- 224 Trafalgar Ln
- 230 Trafalgar Ln
- 232 Trafalgar Ln
- 218 Avenida Barcelona
- 222 Trafalgar Ln
- 219 Trafalgar Ln