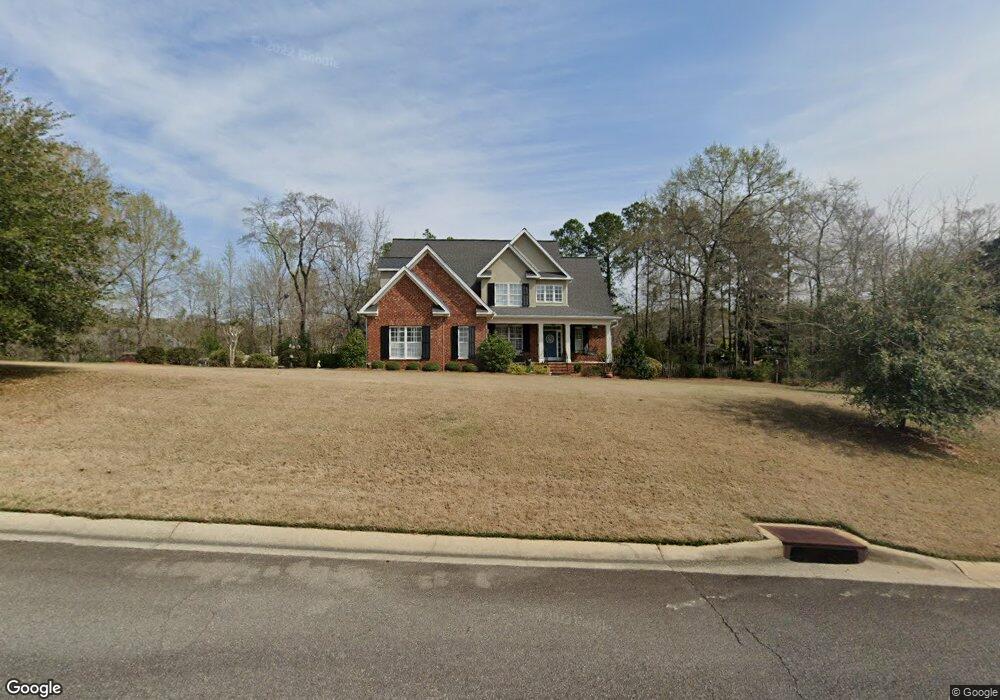
227 Troon W Macon, GA 31210
Estimated Value: $466,000 - $707,000
4
Beds
4
Baths
3,104
Sq Ft
$172/Sq Ft
Est. Value
About This Home
This home is located at 227 Troon W, Macon, GA 31210 and is currently estimated at $533,554, approximately $171 per square foot. 227 Troon W is a home located in Bibb County with nearby schools including Carter Elementary School, Howard Middle School, and Howard High School.
Ownership History
Date
Name
Owned For
Owner Type
Purchase Details
Closed on
Oct 16, 2013
Sold by
Bowman Laura
Bought by
Graves Timothy L and Bowman Laura
Current Estimated Value
Home Financials for this Owner
Home Financials are based on the most recent Mortgage that was taken out on this home.
Original Mortgage
$240,000
Outstanding Balance
$180,363
Interest Rate
4.58%
Mortgage Type
New Conventional
Estimated Equity
$353,191
Purchase Details
Closed on
Feb 7, 2012
Sold by
Henley Adam and Henley Adam C
Bought by
Bowman Laura
Purchase Details
Closed on
Aug 7, 2006
Sold by
Davis Robert D and Davis Linda L
Bought by
Henley Adam C and Henley Brooke B
Home Financials for this Owner
Home Financials are based on the most recent Mortgage that was taken out on this home.
Original Mortgage
$270,400
Interest Rate
7.5%
Mortgage Type
Adjustable Rate Mortgage/ARM
Purchase Details
Closed on
Oct 25, 2004
Purchase Details
Closed on
Oct 9, 2003
Purchase Details
Closed on
Mar 14, 2003
Create a Home Valuation Report for This Property
The Home Valuation Report is an in-depth analysis detailing your home's value as well as a comparison with similar homes in the area
Home Values in the Area
Average Home Value in this Area
Purchase History
| Date | Buyer | Sale Price | Title Company |
|---|---|---|---|
| Graves Timothy L | -- | None Available | |
| Bowman Laura | $234,500 | None Available | |
| Henley Adam C | $338,000 | None Available | |
| -- | -- | -- | |
| -- | $300,000 | -- | |
| -- | $49,000 | -- |
Source: Public Records
Mortgage History
| Date | Status | Borrower | Loan Amount |
|---|---|---|---|
| Open | Graves Timothy L | $240,000 | |
| Previous Owner | Henley Adam C | $270,400 |
Source: Public Records
Tax History Compared to Growth
Tax History
| Year | Tax Paid | Tax Assessment Tax Assessment Total Assessment is a certain percentage of the fair market value that is determined by local assessors to be the total taxable value of land and additions on the property. | Land | Improvement |
|---|---|---|---|---|
| 2025 | $4,088 | $173,336 | $22,000 | $151,336 |
| 2024 | $4,224 | $173,336 | $22,000 | $151,336 |
| 2023 | $4,714 | $166,130 | $22,000 | $144,130 |
| 2022 | $4,903 | $148,630 | $22,176 | $126,454 |
| 2021 | $5,185 | $143,448 | $22,176 | $121,272 |
| 2020 | $4,774 | $129,954 | $21,120 | $108,834 |
| 2019 | $5,208 | $140,050 | $21,120 | $118,930 |
| 2018 | $7,781 | $133,790 | $21,120 | $112,670 |
| 2017 | $4,750 | $133,790 | $21,120 | $112,670 |
| 2016 | $4,387 | $133,790 | $21,120 | $112,670 |
| 2015 | $6,313 | $135,902 | $23,232 | $112,670 |
| 2014 | $6,125 | $131,861 | $29,040 | $102,821 |
Source: Public Records
Map
Nearby Homes
- 740 Ivy Brook Way
- 776 Ivy Brook Way
- 715 Ivy Brook Way
- 785 Ivy Brook Way
- 631 Ivy Brook Way
- 621 Ivy Brook Way
- 2006 Fall Harvest Dr Unit LOT 278
- 2002 Fall Harvest Dr Unit LOT 280
- 2006 Fall Harvest Dr
- 2002 Fall Harvest Dr
- 2008 Fall Harvest Dr Unit LOT 277
- 2004 Fall Harvest Dr
- 2010 Fall Harvest Dr Unit LOT 276
- 2010 Fall Harvest Dr
- 2008 Fall Harvest Dr
- 2004 Fall Harvest Dr Unit LOT 279
- 534 Ivy Brook Way
- 117 Legare Ct
- 305 Carrick Way
- 229 Troon W
- 228 Troon W
- 104 Carrick Way
- W Troon W
- 225 Troon W
- 301 Carrick Way
- 224 Troon W
- 309 Carrick Way
- 233 Troon W
- 233 Troon W Unit 135
- 233 Troon W Unit 35
- 232 Troon W
- 222 Troon W
- 313 Carrick Way
- 304 Carrick Way
- 300 Carrick Way
- 210 Rutledge Way
- 0 Carrick Way Unit 8636205
- 0 Carrick Way Unit 8603978