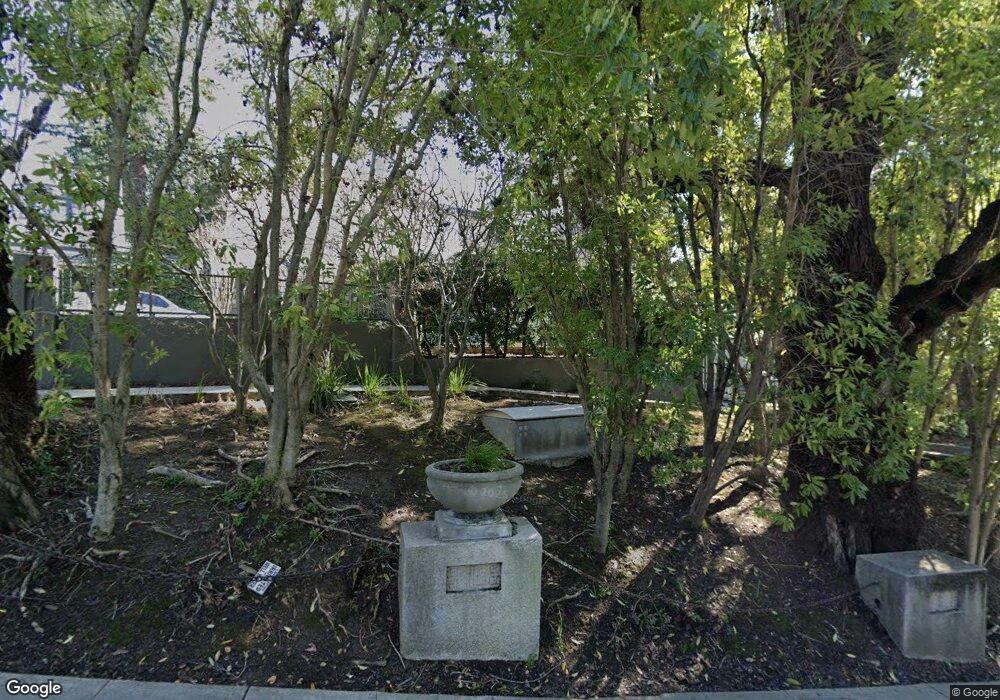
227 Tunnel Rd Berkeley, CA 94705
Claremont NeighborhoodEstimated Value: $2,874,000 - $4,797,000
7
Beds
16
Baths
13,649
Sq Ft
$281/Sq Ft
Est. Value
About This Home
This home is located at 227 Tunnel Rd, Berkeley, CA 94705 and is currently estimated at $3,835,500, approximately $281 per square foot. 227 Tunnel Rd is a home located in Alameda County with nearby schools including John Muir Elementary School, Emerson Elementary School, and Malcolm X Elementary School.
Ownership History
Date
Name
Owned For
Owner Type
Purchase Details
Closed on
Jun 24, 2025
Sold by
Agreem David J Teece Year 2001 Revocable and Teece David J
Bought by
Monarch Tunnel Holdings Llc
Current Estimated Value
Purchase Details
Closed on
Aug 28, 2018
Sold by
Teece David J
Bought by
Revoca Teece David J
Purchase Details
Closed on
Jul 5, 2000
Sold by
Teece David J
Bought by
Teece David J
Purchase Details
Closed on
Sep 21, 1998
Sold by
Teece Leigh
Bought by
Teece David
Purchase Details
Closed on
Dec 14, 1994
Sold by
Teece Leigh G
Bought by
Teece David J
Purchase Details
Closed on
Dec 7, 1994
Sold by
Troy James D and Troy Priscilla L
Bought by
Teece David J
Create a Home Valuation Report for This Property
The Home Valuation Report is an in-depth analysis detailing your home's value as well as a comparison with similar homes in the area
Home Values in the Area
Average Home Value in this Area
Purchase History
| Date | Buyer | Sale Price | Title Company |
|---|---|---|---|
| Monarch Tunnel Holdings Llc | -- | None Listed On Document | |
| Revoca Teece David J | -- | None Available | |
| Teece David J | -- | Placer Title Company | |
| Teece David J | -- | Placer Title Company | |
| Teece David | -- | Placer Title Company | |
| Teece David J | -- | Placer Title Co | |
| Teece David J | $335,000 | Placer Title Company |
Source: Public Records
Tax History Compared to Growth
Tax History
| Year | Tax Paid | Tax Assessment Tax Assessment Total Assessment is a certain percentage of the fair market value that is determined by local assessors to be the total taxable value of land and additions on the property. | Land | Improvement |
|---|---|---|---|---|
| 2025 | $54,599 | $2,868,941 | $1,086,713 | $1,789,228 |
| 2024 | $54,599 | $2,812,561 | $1,065,408 | $1,754,153 |
| 2023 | $53,362 | $2,764,284 | $1,044,521 | $1,719,763 |
| 2022 | $52,135 | $2,703,096 | $1,024,045 | $1,686,051 |
| 2021 | $52,117 | $2,649,959 | $1,003,966 | $1,652,993 |
| 2020 | $48,484 | $2,629,721 | $993,673 | $1,636,048 |
| 2019 | $45,708 | $2,578,170 | $974,193 | $1,603,977 |
| 2018 | $44,784 | $2,527,630 | $955,094 | $1,572,536 |
| 2017 | $43,345 | $2,478,083 | $936,371 | $1,541,712 |
| 2016 | $41,432 | $2,429,507 | $918,015 | $1,511,492 |
| 2015 | $40,795 | $2,393,030 | $904,233 | $1,488,797 |
| 2014 | $40,067 | $2,346,170 | $886,526 | $1,459,644 |
Source: Public Records
Map
Nearby Homes
- 0 Tunnel Rd
- 1522 Grand View Dr
- 1488 Alvarado Rd
- 204 El Camino Real
- 1015 Grand View Dr
- 260 Alvarado Rd
- 142 Gravatt Dr
- 6000 Contra Costa Rd
- 1881 Grand View Dr
- 105 Starview Ct
- 1140 Besito Ave
- 0 Dartmouth Dr
- 7041 Devon Way
- 1215 Alvarado Rd
- 6189 Contra Costa Rd
- 6716 Charing Cross Rd
- 5936 Broadway
- 0 Buckingham Blvd Unit 41115384
- 7003 Buckingham Blvd
- 320 Caldecott Ln Unit 127
