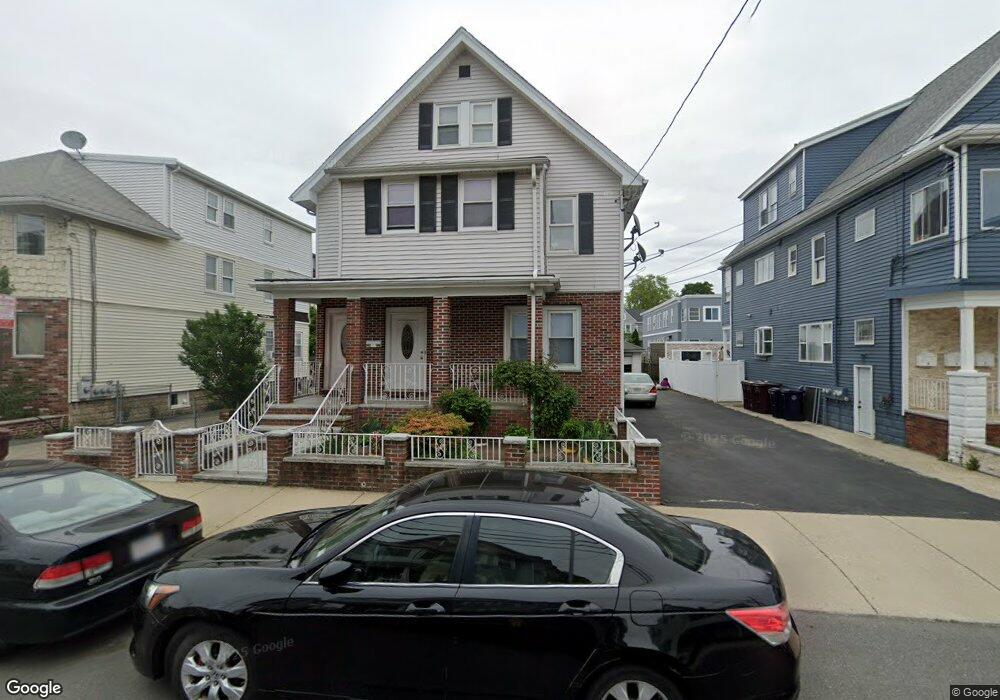
227 Vine St Everett, MA 02149
Glendale NeighborhoodEstimated Value: $824,000 - $1,043,000
6
Beds
2
Baths
2,925
Sq Ft
$325/Sq Ft
Est. Value
About This Home
This home is located at 227 Vine St, Everett, MA 02149 and is currently estimated at $949,507, approximately $324 per square foot. 227 Vine St is a home located in Middlesex County with nearby schools including Everett High School, Pioneer Charter School of Science, and St Anthony School.
Ownership History
Date
Name
Owned For
Owner Type
Purchase Details
Closed on
Sep 26, 2024
Sold by
Le Duong N
Bought by
Le Tram
Current Estimated Value
Purchase Details
Closed on
Apr 15, 2011
Sold by
Le Duong N
Bought by
Everett City Of
Purchase Details
Closed on
Sep 6, 1995
Sold by
Sciarappa James and Sciarappa Dorothy A
Bought by
Le Duong Nguyen
Home Financials for this Owner
Home Financials are based on the most recent Mortgage that was taken out on this home.
Original Mortgage
$100,000
Interest Rate
7.8%
Mortgage Type
Purchase Money Mortgage
Create a Home Valuation Report for This Property
The Home Valuation Report is an in-depth analysis detailing your home's value as well as a comparison with similar homes in the area
Home Values in the Area
Average Home Value in this Area
Purchase History
| Date | Buyer | Sale Price | Title Company |
|---|---|---|---|
| Le Tram | -- | None Available | |
| Le Tram | -- | None Available | |
| Everett City Of | -- | -- | |
| Everett City Of | -- | -- | |
| Le Duong Nguyen | $160,000 | -- | |
| Le Duong Nguyen | $160,000 | -- |
Source: Public Records
Mortgage History
| Date | Status | Borrower | Loan Amount |
|---|---|---|---|
| Previous Owner | Le Duong Nguyen | $100,000 |
Source: Public Records
Tax History
| Year | Tax Paid | Tax Assessment Tax Assessment Total Assessment is a certain percentage of the fair market value that is determined by local assessors to be the total taxable value of land and additions on the property. | Land | Improvement |
|---|---|---|---|---|
| 2025 | $10,423 | $915,100 | $260,100 | $655,000 |
| 2024 | $9,612 | $838,700 | $236,900 | $601,800 |
| 2023 | $9,364 | $794,900 | $226,600 | $568,300 |
| 2022 | $7,676 | $740,900 | $216,300 | $524,600 |
| 2021 | $6,779 | $686,800 | $182,800 | $504,000 |
| 2020 | $7,116 | $668,800 | $182,800 | $486,000 |
| 2019 | $7,479 | $604,100 | $170,500 | $433,600 |
| 2018 | $7,309 | $530,400 | $148,300 | $382,100 |
| 2017 | $6,891 | $477,200 | $123,600 | $353,600 |
| 2016 | $6,380 | $441,500 | $123,600 | $317,900 |
| 2015 | $5,980 | $409,300 | $110,500 | $298,800 |
Source: Public Records
Map
Nearby Homes
- 110 Ferry St
- 99 Florence St
- 114 Francis St
- 20 Ferry St Unit B
- 238 Chelsea St
- 55 Garland St
- 181 Chelsea St
- 20 Fairmount St
- 88 Garland St
- 27 Silver Rd
- 138 Fremont Ave
- 21 Hillside Ave Unit 21
- 211 Elm St
- 62 Madison Ave
- 101 Springvale Ave
- 378 Ferry St
- 7 Ingleside Ave
- 51 Adams Ave
- 24 Corey St Unit 101
- 124 Addison St Unit 15
Your Personal Tour Guide
Ask me questions while you tour the home.