Estimated Value: $180,000 - $274,000
3
Beds
1
Bath
1,338
Sq Ft
$164/Sq Ft
Est. Value
About This Home
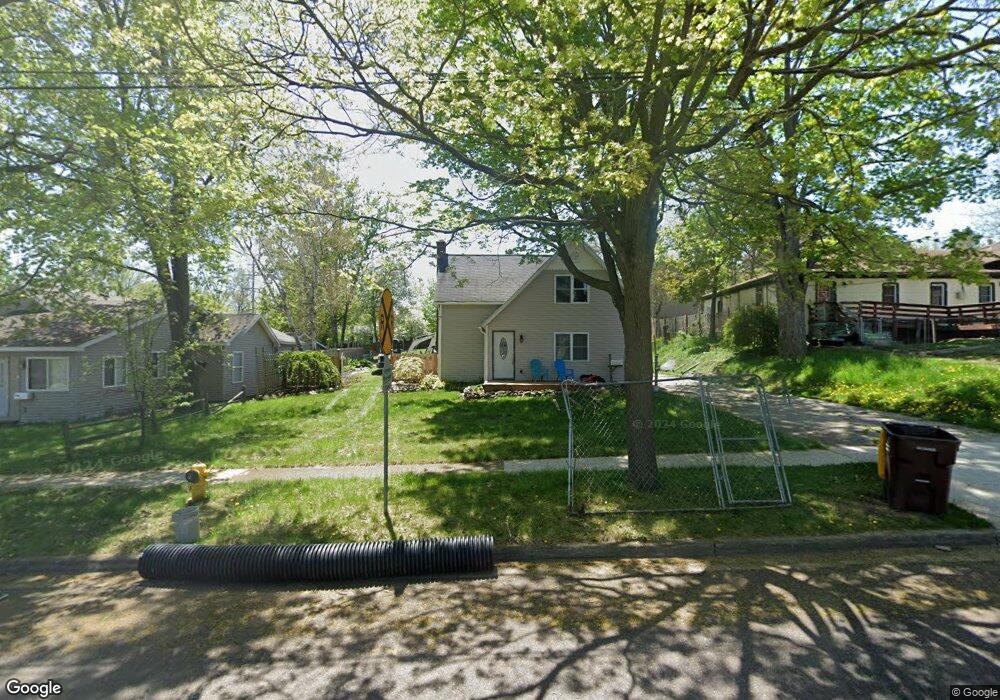
This home is located at 227 W Elm St, Mason, MI 48854 and is currently estimated at $219,862, approximately $164 per square foot. 227 W Elm St is a home located in Ingham County with nearby schools including Mason High School.
Ownership History
Date
Name
Owned For
Owner Type
Purchase Details
Closed on
Dec 13, 2001
Sold by
Byington Juli Chamberlin
Bought by
Thomas Dale A
Current Estimated Value
Home Financials for this Owner
Home Financials are based on the most recent Mortgage that was taken out on this home.
Original Mortgage
$100,000
Interest Rate
7.16%
Mortgage Type
Purchase Money Mortgage
Purchase Details
Closed on
Apr 16, 2001
Sold by
Laughery Sean C and Laughery Corinne M
Bought by
Byington Juli Chamberlin
Home Financials for this Owner
Home Financials are based on the most recent Mortgage that was taken out on this home.
Original Mortgage
$60,000
Interest Rate
6.99%
Mortgage Type
Purchase Money Mortgage
Purchase Details
Closed on
May 22, 1998
Sold by
Russell Larry and Russell Roseann
Bought by
Laughery Sean and Laughery Corinne
Purchase Details
Closed on
Mar 11, 1992
Sold by
Russell Roseann
Create a Home Valuation Report for This Property
The Home Valuation Report is an in-depth analysis detailing your home's value as well as a comparison with similar homes in the area
Home Values in the Area
Average Home Value in this Area
Purchase History
| Date | Buyer | Sale Price | Title Company |
|---|---|---|---|
| Thomas Dale A | $100,000 | First American Title Ins Co | |
| Byington Juli Chamberlin | $87,000 | -- | |
| Laughery Sean | $68,200 | -- | |
| -- | $48,000 | -- |
Source: Public Records
Mortgage History
| Date | Status | Borrower | Loan Amount |
|---|---|---|---|
| Previous Owner | Thomas Dale A | $100,000 | |
| Previous Owner | Byington Juli Chamberlin | $60,000 |
Source: Public Records
Tax History Compared to Growth
Tax History
| Year | Tax Paid | Tax Assessment Tax Assessment Total Assessment is a certain percentage of the fair market value that is determined by local assessors to be the total taxable value of land and additions on the property. | Land | Improvement |
|---|---|---|---|---|
| 2025 | $3,223 | $95,680 | $31,420 | $64,260 |
| 2024 | $3,015 | $90,230 | $29,570 | $60,660 |
| 2023 | $3,015 | $81,410 | $24,020 | $57,390 |
| 2022 | $2,875 | $77,230 | $27,250 | $49,980 |
| 2021 | $2,768 | $71,750 | $27,250 | $44,500 |
| 2020 | $2,725 | $67,440 | $27,250 | $40,190 |
| 2019 | $2,620 | $65,410 | $21,800 | $43,610 |
| 2018 | $2,572 | $60,350 | $21,800 | $38,550 |
| 2017 | $2,333 | $60,350 | $21,800 | $38,550 |
| 2016 | -- | $50,930 | $10,900 | $40,030 |
| 2015 | -- | $45,080 | $21,797 | $23,283 |
| 2014 | -- | $45,530 | $29,062 | $16,468 |
Source: Public Records
Map
Nearby Homes
- 116 E Elm St
- 833 S Barnes St
- 317 E Elm St
- 404 E Cherry St
- 427 E Ash St
- 209 Peachtree Place
- 327 Steele St
- 902 Eagles Nest Ct
- 105 Carom Cir
- 117 Lawton St
- 311 Carom Cir
- 32 Aviemore Dr Unit 32
- 915 Carom Cir
- 814 Carom Cir Unit 142
- 1470 N Cedar St
- 202 Stratford Dr
- 434 Ravenwood Ct
- 0 Sanctuary
- 330 Oak Ridge St
- 411 Bubbling Springs Ct
- 235 W Elm St
- 225 W Elm St
- 629 Henderson St
- 222 W Cherry St
- 226 W Elm St Unit 224226
- 228 W Elm St
- 630 Henderson St
- 310 W Cherry St
- 238 W Elm St
- 302 W Cherry St Unit 302-30
- 309 W Elm St
- 312 W Cherry St Unit 310312
- 312 W Cherry St Unit 2
- 306 W Elm St
- 317 W Elm St Unit 315317
- 223 W Cherry St Unit 223225
- 229 W Cherry St Unit 229231
- 320 W Cherry St Unit 320322
- 217 W Cherry St Unit 217219