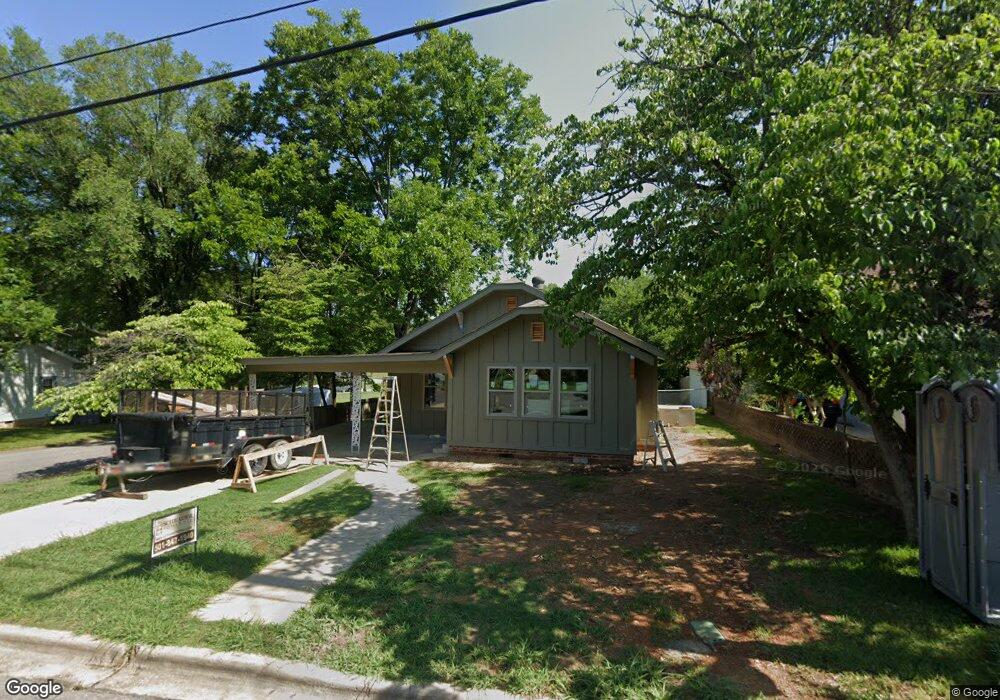
227 W Narroway St Benton, AR 72015
Estimated Value: $147,071 - $189,000
2
Beds
2
Baths
1,042
Sq Ft
$158/Sq Ft
Est. Value
About This Home
This home is located at 227 W Narroway St, Benton, AR 72015 and is currently estimated at $165,018, approximately $158 per square foot. 227 W Narroway St is a home located in Saline County with nearby schools including Ringgold Elementary School, Benton Middle School, and Benton Junior High School.
Ownership History
Date
Name
Owned For
Owner Type
Purchase Details
Closed on
Mar 3, 2023
Sold by
Schrader Bruce Alan and Schrader Ginger Leigh
Bought by
Haley Schrader Trust and Schrader
Current Estimated Value
Purchase Details
Closed on
Mar 2, 2023
Sold by
Ag Investments Llc
Bought by
Schrader Bruce Alan and Schrader Ginger Leigh
Purchase Details
Closed on
Jan 10, 2020
Sold by
Patrick Jeffery R and Patrick Denise A
Bought by
Ag Investments Llc
Purchase Details
Closed on
Nov 18, 2016
Sold by
Failla Michael
Bought by
Patrick Jeffery R and Patrick Denise A
Home Financials for this Owner
Home Financials are based on the most recent Mortgage that was taken out on this home.
Original Mortgage
$51,750
Interest Rate
3.47%
Mortgage Type
Commercial
Purchase Details
Closed on
Jan 23, 2002
Bought by
Failla
Purchase Details
Closed on
Apr 18, 2000
Bought by
Bagby
Purchase Details
Closed on
Oct 1, 1991
Bought by
Nalley
Create a Home Valuation Report for This Property
The Home Valuation Report is an in-depth analysis detailing your home's value as well as a comparison with similar homes in the area
Home Values in the Area
Average Home Value in this Area
Purchase History
| Date | Buyer | Sale Price | Title Company |
|---|---|---|---|
| Haley Schrader Trust | -- | None Listed On Document | |
| Schrader Bruce Alan | -- | None Listed On Document | |
| Ag Investments Llc | $137,000 | Lenders Title Company | |
| Patrick Jeffery R | $69,500 | Lenders Title Company | |
| Failla | $83,000 | -- | |
| Bagby | $78,000 | -- | |
| Nalley | -- | -- | |
| Nalley | $38,000 | -- |
Source: Public Records
Mortgage History
| Date | Status | Borrower | Loan Amount |
|---|---|---|---|
| Previous Owner | Patrick Jeffery R | $51,750 |
Source: Public Records
Tax History Compared to Growth
Tax History
| Year | Tax Paid | Tax Assessment Tax Assessment Total Assessment is a certain percentage of the fair market value that is determined by local assessors to be the total taxable value of land and additions on the property. | Land | Improvement |
|---|---|---|---|---|
| 2025 | $1,086 | $19,610 | $4,000 | $15,610 |
| 2024 | $1,112 | $19,610 | $4,000 | $15,610 |
| 2023 | $1,086 | $19,610 | $4,000 | $15,610 |
| 2022 | $1,050 | $19,610 | $4,000 | $15,610 |
| 2021 | $955 | $17,240 | $4,000 | $13,240 |
| 2020 | $955 | $17,240 | $4,000 | $13,240 |
| 2019 | $955 | $17,240 | $4,000 | $13,240 |
| 2018 | $953 | $17,240 | $4,000 | $13,240 |
| 2017 | $953 | $17,240 | $4,000 | $13,240 |
| 2016 | $1,022 | $18,020 | $4,000 | $14,020 |
| 2015 | $1,011 | $18,020 | $4,000 | $14,020 |
| 2014 | $661 | $18,020 | $4,000 | $14,020 |
Source: Public Records
Map
Nearby Homes
- 406 W Narroway St
- 521 W Cross St
- 305 N East St
- 721 W Narroway St
- 722 W Narroway St
- 507 Lillian
- 401 W South St
- 111 N 1st St
- 424 E Sevier St
- 801 Pinewood Dr
- 908 Park Dr
- 1201 Venturi
- 1107 J Cove W
- 1500 W Sevier St
- 1126 Heights Rd
- 303 Dobbs St
- 503 S 1st St
- 1007 Montclair St
- 416 Jackman St
- Lot 2 Woodland
- 221 W Narroway St
- 303 W Narroway St
- 215 W Narroway St
- 309 W Narroway St
- 311 W Narroway St
- 224 W Narroway St
- 224 W Narroway St
- 220 W Carpenter St Unit 225
- 700 Crestwood Dr
- 220 W Narroway St
- 308 W Narroway St
- 214 W Narroway St
- 604 N Market St
- 610 N Market St
- 616 N Market St
- W Carpenter
- 321 W Narroway St
- 321 W Narroway St
- 210 W Carpenter St
- 522 N Market St