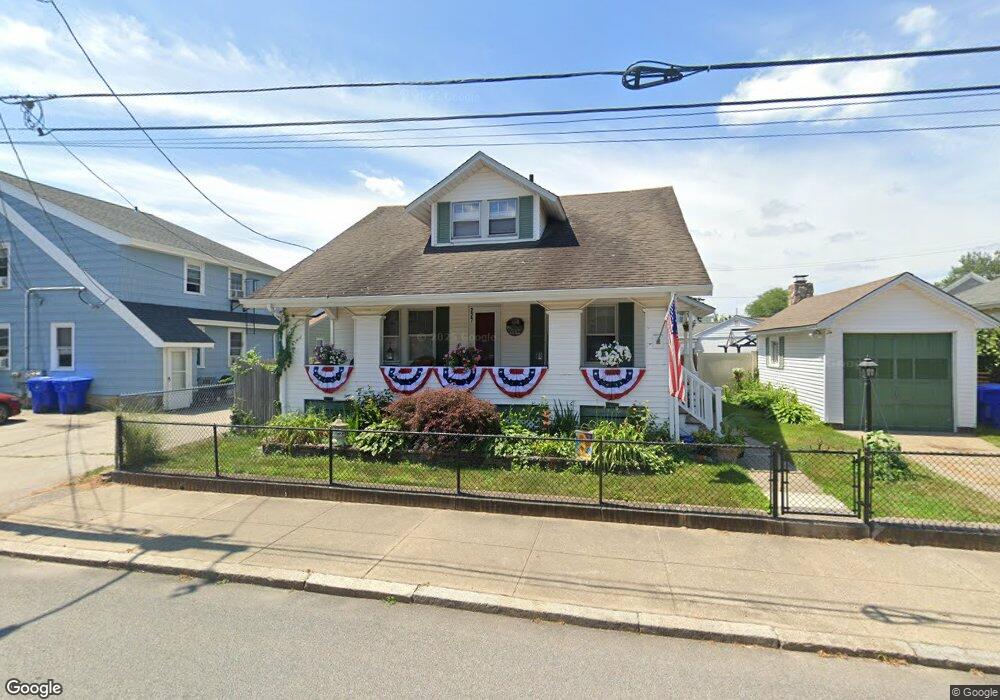
227 Webster St Pawtucket, RI 02861
Darlington NeighborhoodEstimated Value: $391,000 - $410,000
3
Beds
1
Bath
1,669
Sq Ft
$239/Sq Ft
Est. Value
About This Home
This home is located at 227 Webster St, Pawtucket, RI 02861 and is currently estimated at $399,229, approximately $239 per square foot. 227 Webster St is a home located in Providence County with nearby schools including St Cecilia School and Saint Raphael Academy.
Ownership History
Date
Name
Owned For
Owner Type
Purchase Details
Closed on
Jun 16, 2009
Sold by
Valencia Nelson and Rueda Veronica
Bought by
Summerly Theresa A
Current Estimated Value
Home Financials for this Owner
Home Financials are based on the most recent Mortgage that was taken out on this home.
Original Mortgage
$112,000
Outstanding Balance
$70,650
Interest Rate
4.82%
Mortgage Type
Purchase Money Mortgage
Estimated Equity
$328,579
Purchase Details
Closed on
Jul 27, 2005
Sold by
Maurice John S
Bought by
Valencia Nelson and Rueda Veronica
Home Financials for this Owner
Home Financials are based on the most recent Mortgage that was taken out on this home.
Original Mortgage
$196,000
Interest Rate
5.67%
Mortgage Type
Purchase Money Mortgage
Purchase Details
Closed on
Dec 11, 1995
Sold by
Willett John K
Bought by
Maurice John S
Create a Home Valuation Report for This Property
The Home Valuation Report is an in-depth analysis detailing your home's value as well as a comparison with similar homes in the area
Home Values in the Area
Average Home Value in this Area
Purchase History
| Date | Buyer | Sale Price | Title Company |
|---|---|---|---|
| Summerly Theresa A | $140,000 | -- | |
| Valencia Nelson | $245,000 | -- | |
| Maurice John S | $83,500 | -- |
Source: Public Records
Mortgage History
| Date | Status | Borrower | Loan Amount |
|---|---|---|---|
| Open | Maurice John S | $23,500 | |
| Open | Maurice John S | $112,000 | |
| Previous Owner | Maurice John S | $196,000 |
Source: Public Records
Tax History
| Year | Tax Paid | Tax Assessment Tax Assessment Total Assessment is a certain percentage of the fair market value that is determined by local assessors to be the total taxable value of land and additions on the property. | Land | Improvement |
|---|---|---|---|---|
| 2025 | $3,472 | $264,000 | $119,300 | $144,700 |
| 2024 | $3,258 | $264,000 | $119,300 | $144,700 |
| 2023 | $3,463 | $204,400 | $74,600 | $129,800 |
| 2022 | $3,389 | $204,400 | $74,600 | $129,800 |
| 2021 | $3,389 | $204,400 | $74,600 | $129,800 |
| 2020 | $3,134 | $150,000 | $58,900 | $91,100 |
| 2019 | $3,134 | $150,000 | $58,900 | $91,100 |
| 2018 | $3,020 | $150,000 | $58,900 | $91,100 |
| 2017 | $2,765 | $121,700 | $47,200 | $74,500 |
| 2016 | $2,664 | $121,700 | $47,200 | $74,500 |
| 2015 | $2,664 | $121,700 | $47,200 | $74,500 |
| 2014 | $2,553 | $110,700 | $47,200 | $63,500 |
Source: Public Records
Map
Nearby Homes
Your Personal Tour Guide
Ask me questions while you tour the home.