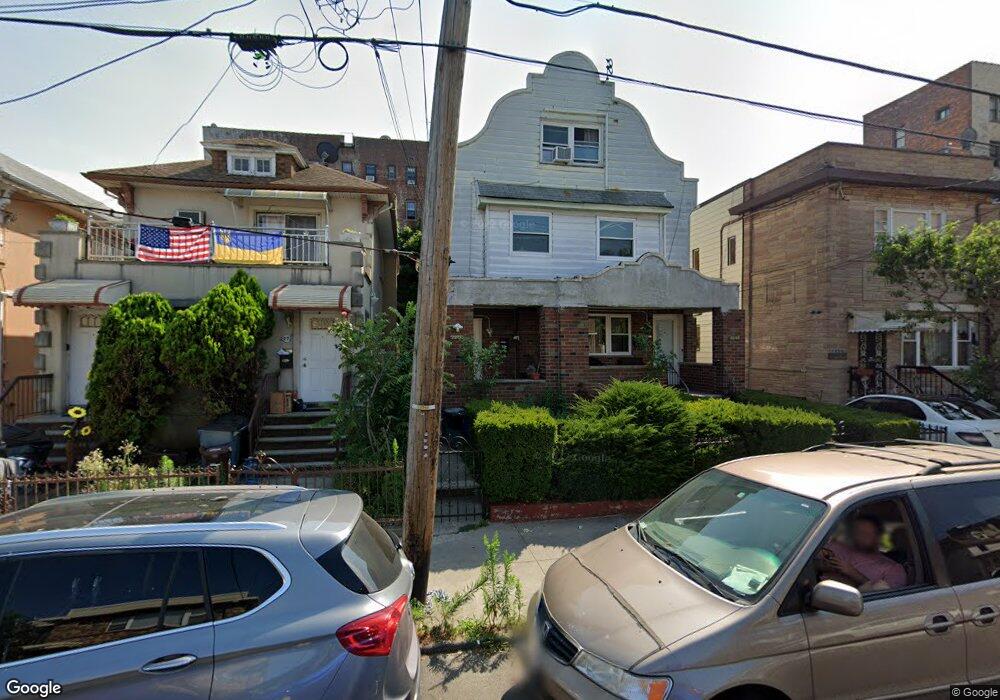
2270 83rd St Brooklyn, NY 11214
Gravesend NeighborhoodEstimated Value: $1,715,162 - $1,992,000
Studio
--
Bath
3,300
Sq Ft
$559/Sq Ft
Est. Value
About This Home
This home is located at 2270 83rd St, Brooklyn, NY 11214 and is currently estimated at $1,844,291, approximately $558 per square foot. 2270 83rd St is a home located in Kings County with nearby schools including P.S. 128K BENSONHURST, Is 281 Joseph B Cavallaro, and Hebrew Language Academy Charter 2.
Ownership History
Date
Name
Owned For
Owner Type
Purchase Details
Closed on
Sep 15, 2011
Sold by
Joan Angelico Trust
Bought by
Ho Keenis
Current Estimated Value
Home Financials for this Owner
Home Financials are based on the most recent Mortgage that was taken out on this home.
Original Mortgage
$134,845
Interest Rate
4.15%
Purchase Details
Closed on
Jun 2, 2001
Sold by
Angelico Joan
Bought by
Puccia Tina
Create a Home Valuation Report for This Property
The Home Valuation Report is an in-depth analysis detailing your home's value as well as a comparison with similar homes in the area
Home Values in the Area
Average Home Value in this Area
Purchase History
| Date | Buyer | Sale Price | Title Company |
|---|---|---|---|
| Ho Keenis | $905,000 | -- | |
| Joan Angelico Trust | -- | -- | |
| Puccia Tina | -- | -- |
Source: Public Records
Mortgage History
| Date | Status | Borrower | Loan Amount |
|---|---|---|---|
| Previous Owner | Joan Angelico Trust | $134,845 | |
| Previous Owner | Ho Keenis | $678,750 |
Source: Public Records
Tax History
| Year | Tax Paid | Tax Assessment Tax Assessment Total Assessment is a certain percentage of the fair market value that is determined by local assessors to be the total taxable value of land and additions on the property. | Land | Improvement |
|---|---|---|---|---|
| 2025 | $11,815 | $125,580 | $17,400 | $108,180 |
| 2024 | $11,815 | $106,920 | $17,400 | $89,520 |
| 2023 | $11,603 | $109,620 | $17,400 | $92,220 |
| 2022 | $10,890 | $94,680 | $17,400 | $77,280 |
| 2021 | $10,938 | $102,000 | $17,400 | $84,600 |
| 2020 | $5,436 | $112,020 | $17,400 | $94,620 |
| 2019 | $10,255 | $100,920 | $17,400 | $83,520 |
| 2018 | $9,047 | $47,612 | $9,084 | $38,528 |
| 2017 | $8,621 | $45,460 | $9,023 | $36,437 |
| 2016 | $8,037 | $43,312 | $10,372 | $32,940 |
| 2015 | $4,290 | $43,312 | $15,548 | $27,764 |
| 2014 | $4,290 | $37,600 | $14,482 | $23,118 |
Source: Public Records
Map
Nearby Homes
- 2270 84th St
- 2321 83rd St
- 2227 83rd St
- 2346 82nd St
- 2219 83rd St
- 8113 23rd Ave
- 2358 84th St
- 2357 84th St Unit 1A
- 2231 86th St
- 2369 82nd St Unit 202
- 2347 81st St
- 8320 Bay Pkwy Unit C32
- 8320 Bay Pkwy Unit C21
- 8320 Bay Pkwy Unit B25
- 8320 Bay Pkwy Unit B21
- 2332 86th St
- 8619 23rd Ave
- 2402 82nd St
- 2404 84th St
- 8100 Bay Pkwy Unit 4E
Your Personal Tour Guide
Ask me questions while you tour the home.