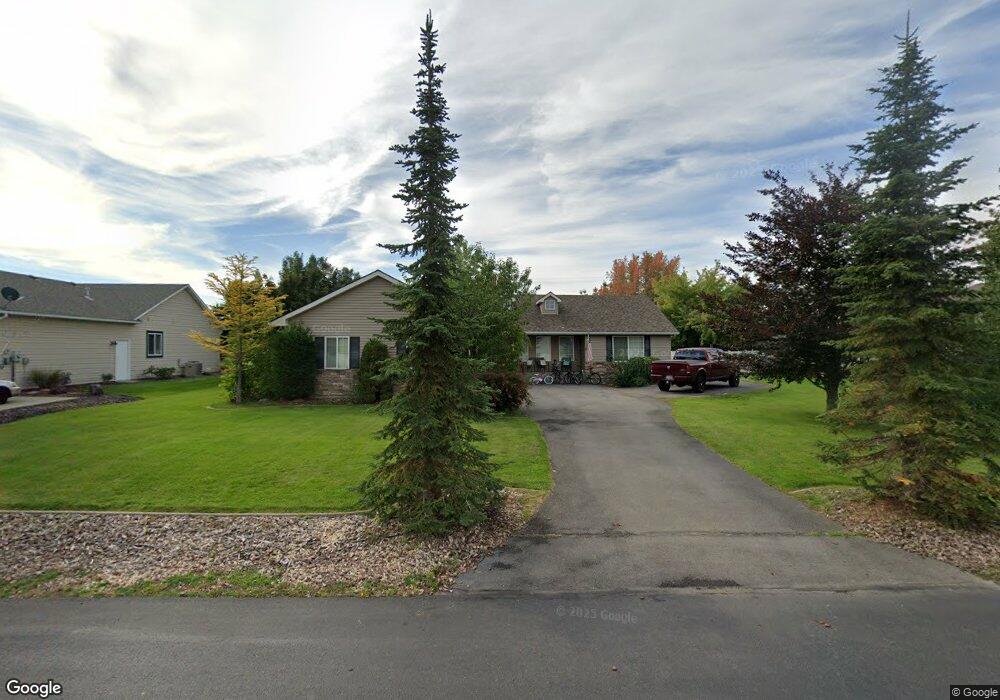
2270 W Falling Star Loop Post Falls, ID 83854
North Prairie NeighborhoodEstimated Value: $679,000 - $789,000
3
Beds
2
Baths
2,045
Sq Ft
$355/Sq Ft
Est. Value
About This Home
This home is located at 2270 W Falling Star Loop, Post Falls, ID 83854 and is currently estimated at $725,334, approximately $354 per square foot. 2270 W Falling Star Loop is a home located in Kootenai County with nearby schools including West Ridge Elementary School, River City Middle School, and Post Falls High School.
Ownership History
Date
Name
Owned For
Owner Type
Purchase Details
Closed on
May 30, 2017
Sold by
Tune Christina B
Bought by
Tune Christopher D
Current Estimated Value
Purchase Details
Closed on
May 25, 2017
Sold by
Padula John P and Padula Amanda
Bought by
Tune Christopher D
Purchase Details
Closed on
Mar 24, 2016
Sold by
Padula Amanda
Bought by
Padula John
Home Financials for this Owner
Home Financials are based on the most recent Mortgage that was taken out on this home.
Original Mortgage
$275,793
Interest Rate
4.4%
Mortgage Type
FHA
Purchase Details
Closed on
Jul 11, 2005
Sold by
Ballard Larry A and Ballard Paula L
Bought by
Miller John P and Miller Linda S
Create a Home Valuation Report for This Property
The Home Valuation Report is an in-depth analysis detailing your home's value as well as a comparison with similar homes in the area
Home Values in the Area
Average Home Value in this Area
Purchase History
| Date | Buyer | Sale Price | Title Company |
|---|---|---|---|
| Tune Christopher D | -- | First American Title Kootena | |
| Tune Christopher D | -- | First American Title Kootena | |
| Padula John | -- | Kootenai County Title Compan | |
| Webb Kathleen | -- | Kootenai County Title Compan | |
| Padula John | -- | Kootenai County Title Compan | |
| Miller John P | -- | -- |
Source: Public Records
Mortgage History
| Date | Status | Borrower | Loan Amount |
|---|---|---|---|
| Previous Owner | Padula John | $275,793 |
Source: Public Records
Tax History
| Year | Tax Paid | Tax Assessment Tax Assessment Total Assessment is a certain percentage of the fair market value that is determined by local assessors to be the total taxable value of land and additions on the property. | Land | Improvement |
|---|---|---|---|---|
| 2025 | $3,877 | $653,040 | $245,000 | $408,040 |
| 2024 | $3,680 | $592,270 | $187,000 | $405,270 |
| 2023 | $3,680 | $633,375 | $220,000 | $413,375 |
| 2022 | $4,423 | $727,955 | $270,000 | $457,955 |
| 2021 | $4,500 | $451,440 | $150,000 | $301,440 |
| 2020 | $4,504 | $400,310 | $130,000 | $270,310 |
| 2019 | $3,714 | $396,660 | $115,000 | $281,660 |
| 2018 | $3,464 | $350,910 | $95,000 | $255,910 |
| 2017 | $2,796 | $284,440 | $75,000 | $209,440 |
| 2016 | $2,256 | $234,490 | $60,000 | $174,490 |
| 2015 | $2,181 | $222,420 | $55,000 | $167,420 |
| 2013 | $1,986 | $192,490 | $40,000 | $152,490 |
Source: Public Records
Map
Nearby Homes
- 2661 N Distant Star Rd
- 2145 W Grange Ave
- 2300 W Polo Green Ave
- 4278 N Arrowleaf Loop
- 4260 N Arrowleaf Loop
- 2036 N Skagit Dr
- 1971 N Skagit Dr
- 2021 N Skagit Dr
- 2101 N Skagit Dr
- 1999 N Skagit Dr
- 2045 N Skagit Dr
- 2133 W Platte Ct
- 2115 W Platte Ct
- 3145 W Poleline Ave
- 2120 W Platte Ct
- 1688 Umpqua Ct
- 2118 N Teanaway
- 13559 W Prairie Ave
- 3373 N Coleman St
- 1531 N Wilhelm Way
- 2298 W Falling Star Loop
- 2238 W Falling Star Loop
- 2505 N Howell Rd
- 2643 N Howell Rd
- 2328 W Falling Star Loop
- 0 Howell Rd
- 2431 N Howell Rd
- 2399 N Howell Rd
- 2301 W Falling Star Loop
- 2360 W Falling Star Loop
- 2673 N Howell Rd
- 2333 W Falling Star Loop
- 2369 N Howell Rd
- 2427 W Falling Star Loop
- 2701 N Howell Rd
- 2337 N Howell Rd
- 2378 W Falling Star Loop
- 2576 W Evening Star Rd
- 2412 N Howell Rd
- 2380 N Howell Rd
Your Personal Tour Guide
Ask me questions while you tour the home.