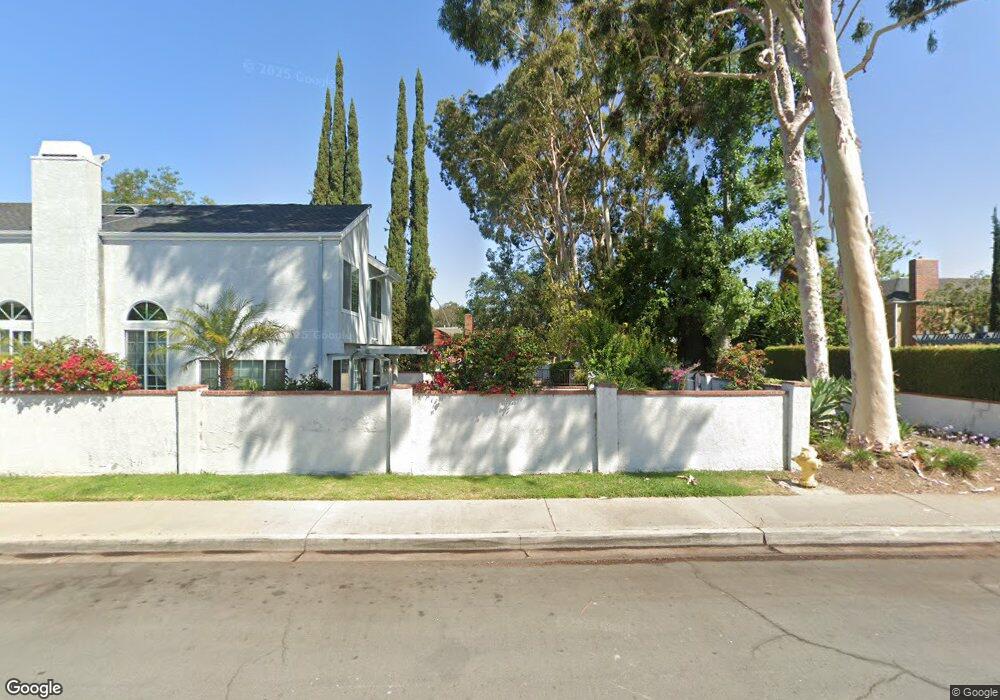
22708 Wood Lake Ln Lake Forest, CA 92630
Estimated Value: $1,372,197 - $1,783,000
3
Beds
3
Baths
2,268
Sq Ft
$686/Sq Ft
Est. Value
About This Home
This home is located at 22708 Wood Lake Ln, Lake Forest, CA 92630 and is currently estimated at $1,556,299, approximately $686 per square foot. 22708 Wood Lake Ln is a home located in Orange County with nearby schools including Santiago STEAM Magnet Elementary School, Serrano Intermediate School, and El Toro High School.
Ownership History
Date
Name
Owned For
Owner Type
Purchase Details
Closed on
May 10, 2016
Sold by
Vistaunet Alv L and Vistaunet Judy L
Bought by
The 1987 Vistaunet Family Trust
Current Estimated Value
Home Financials for this Owner
Home Financials are based on the most recent Mortgage that was taken out on this home.
Original Mortgage
$166,000
Outstanding Balance
$131,845
Interest Rate
3.59%
Mortgage Type
New Conventional
Estimated Equity
$1,424,454
Purchase Details
Closed on
Jan 4, 2008
Sold by
Vistaunet Alv and Vistaunet Judy
Bought by
Vistaunet Alv Lowell and Vistaunet Judy Lynn
Purchase Details
Closed on
May 24, 1995
Sold by
Bond Ginny
Bought by
Vistaunet Alv L and Vistaunet Judy L
Home Financials for this Owner
Home Financials are based on the most recent Mortgage that was taken out on this home.
Original Mortgage
$130,000
Interest Rate
7.88%
Create a Home Valuation Report for This Property
The Home Valuation Report is an in-depth analysis detailing your home's value as well as a comparison with similar homes in the area
Home Values in the Area
Average Home Value in this Area
Purchase History
| Date | Buyer | Sale Price | Title Company |
|---|---|---|---|
| The 1987 Vistaunet Family Trust | -- | Accommodation | |
| Vistaunet Alv L | -- | Lawyers Title | |
| Vistaunet Alv Lowell | -- | None Available | |
| Vistaunet Alv Lowell | -- | None Available | |
| Vistaunet Alv L | $262,000 | Old Republic Title Company |
Source: Public Records
Mortgage History
| Date | Status | Borrower | Loan Amount |
|---|---|---|---|
| Open | Vistaunet Alv L | $166,000 | |
| Closed | Vistaunet Alv L | $130,000 |
Source: Public Records
Tax History Compared to Growth
Tax History
| Year | Tax Paid | Tax Assessment Tax Assessment Total Assessment is a certain percentage of the fair market value that is determined by local assessors to be the total taxable value of land and additions on the property. | Land | Improvement |
|---|---|---|---|---|
| 2025 | $2,578 | $258,535 | $85,509 | $173,026 |
| 2024 | $2,578 | $253,466 | $83,832 | $169,634 |
| 2023 | $2,516 | $248,497 | $82,189 | $166,308 |
| 2022 | $2,470 | $243,625 | $80,577 | $163,048 |
| 2021 | $2,419 | $238,849 | $78,998 | $159,851 |
| 2020 | $2,397 | $236,400 | $78,188 | $158,212 |
| 2019 | $2,348 | $231,765 | $76,655 | $155,110 |
| 2018 | $2,303 | $227,221 | $75,152 | $152,069 |
| 2017 | $2,256 | $222,766 | $73,678 | $149,088 |
| 2016 | $2,217 | $218,399 | $72,234 | $146,165 |
| 2015 | $2,189 | $215,119 | $71,149 | $143,970 |
| 2014 | $2,140 | $210,906 | $69,756 | $141,150 |
Source: Public Records
Map
Nearby Homes
- 22661 Pine Lake Ln
- 22627 Lakeside Ln
- 22682 S Canada Ct
- 22576 Lake Forest Ln
- 24210 Jasper Lake Ln Unit 52
- 22482 Lake Forest Ln
- 22875 Ridge Route Ln
- 24001 Muirlands Blvd Unit 411
- 24001 Muirlands Blvd Unit 56
- 24001 Muirlands Blvd Unit 221
- 24001 Muirlands Blvd Unit 185
- 24001 Muirlands Blvd Unit 329
- 24001 Muirlands Blvd Unit 347
- 24001 Muirlands Blvd Unit 115
- 24001 Muirlands Blvd Unit 34
- 24001 Muirlands Blvd Unit 119
- 24001 Muirlands Blvd Unit 268
- 24001 Muirlands Blvd Unit 147
- 24001 Muirlands Blvd Unit 62
- 24001 Muirlands Blvd Unit 168
- 22706 Wood Lake Ln
- 22704 Wood Lake Ln
- 22675 Pine Lake Ln
- 22702 Wood Lake Ln
- 22671 Pine Lake Ln
- 22701 Wood Lake Ln
- 22712 Wood Lake Ln
- 22665 Pine Lake Ln
- 22705 Wood Lake Ln
- 22681 Pine Lake Ln
- 22722 Wood Lake Ln
- 22711 Wood Lake Ln
- 22685 Pine Lake Ln
- 22662 Pine Lake Ln
- 22732 Wood Lake Ln
- 22715 Wood Lake Ln
- 22691 Pine Lake Ln
- 22668 Pine Lake Ln
- 22741 Wood Lake Ln
- 22621 Lakeside Ln