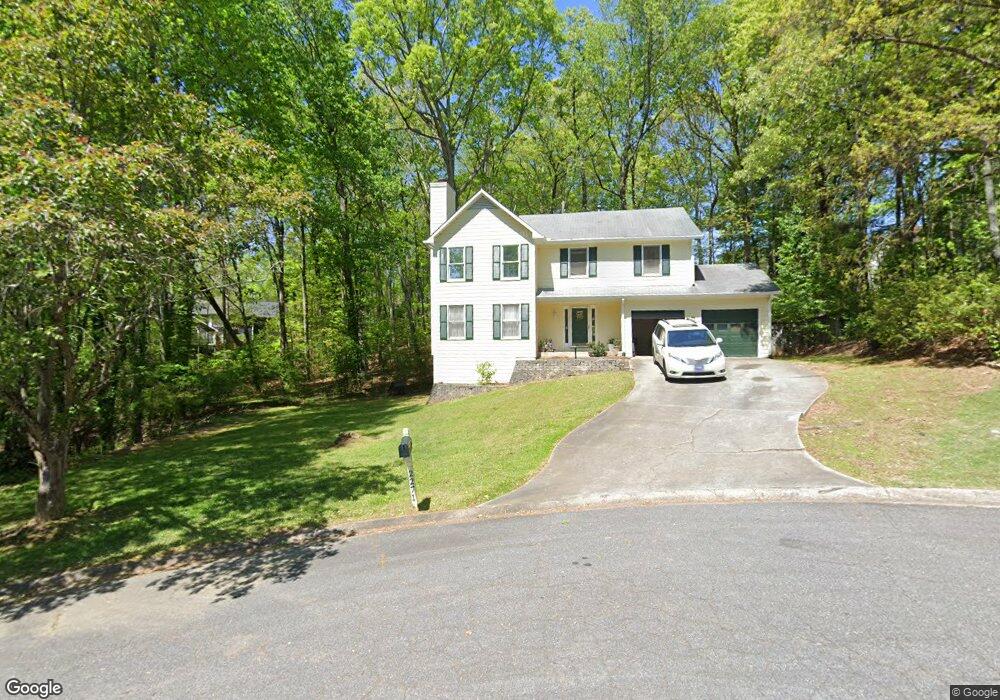
2271 Brookmont Trace SW Marietta, GA 30064
West Cobb NeighborhoodEstimated Value: $377,000 - $477,000
4
Beds
3
Baths
2,016
Sq Ft
$208/Sq Ft
Est. Value
About This Home
This home is located at 2271 Brookmont Trace SW, Marietta, GA 30064 and is currently estimated at $418,601, approximately $207 per square foot. 2271 Brookmont Trace SW is a home located in Cobb County with nearby schools including Cheatham Hill Elementary School, Lovinggood Middle School, and Hillgrove High School.
Ownership History
Date
Name
Owned For
Owner Type
Purchase Details
Closed on
Aug 25, 2017
Sold by
Hidlay Rose Marie
Bought by
Hidlay Rose M and Hidlay Robert W
Current Estimated Value
Home Financials for this Owner
Home Financials are based on the most recent Mortgage that was taken out on this home.
Original Mortgage
$196,377
Outstanding Balance
$163,462
Interest Rate
3.87%
Mortgage Type
FHA
Estimated Equity
$255,139
Purchase Details
Closed on
Apr 28, 2004
Sold by
Homer Tracy J
Bought by
Evans Rose M
Home Financials for this Owner
Home Financials are based on the most recent Mortgage that was taken out on this home.
Original Mortgage
$165,300
Interest Rate
5.63%
Mortgage Type
New Conventional
Purchase Details
Closed on
Jun 30, 1998
Sold by
Weller Mitchell W and Weller Bobbie L
Bought by
Homer Tracy J and Mayes Tammy R
Home Financials for this Owner
Home Financials are based on the most recent Mortgage that was taken out on this home.
Original Mortgage
$121,400
Interest Rate
7.1%
Mortgage Type
New Conventional
Create a Home Valuation Report for This Property
The Home Valuation Report is an in-depth analysis detailing your home's value as well as a comparison with similar homes in the area
Home Values in the Area
Average Home Value in this Area
Purchase History
| Date | Buyer | Sale Price | Title Company |
|---|---|---|---|
| Hidlay Rose M | -- | -- | |
| Evans Rose M | $174,000 | -- | |
| Homer Tracy J | $134,900 | -- |
Source: Public Records
Mortgage History
| Date | Status | Borrower | Loan Amount |
|---|---|---|---|
| Open | Hidlay Rose M | $196,377 | |
| Previous Owner | Evans Rose M | $165,300 | |
| Previous Owner | Homer Tracy J | $121,400 |
Source: Public Records
Tax History Compared to Growth
Tax History
| Year | Tax Paid | Tax Assessment Tax Assessment Total Assessment is a certain percentage of the fair market value that is determined by local assessors to be the total taxable value of land and additions on the property. | Land | Improvement |
|---|---|---|---|---|
| 2025 | $943 | $166,528 | $24,800 | $141,728 |
| 2024 | $947 | $166,528 | $24,800 | $141,728 |
| 2023 | $685 | $148,076 | $28,800 | $119,276 |
| 2022 | $862 | $138,288 | $24,800 | $113,488 |
| 2021 | $767 | $106,548 | $20,800 | $85,748 |
| 2020 | $717 | $89,684 | $20,800 | $68,884 |
| 2019 | $717 | $89,684 | $20,800 | $68,884 |
| 2018 | $702 | $84,768 | $20,800 | $63,968 |
| 2017 | $620 | $84,768 | $20,800 | $63,968 |
| 2016 | $584 | $72,408 | $17,480 | $54,928 |
| 2015 | $627 | $72,408 | $17,480 | $54,928 |
| 2014 | $558 | $58,420 | $0 | $0 |
Source: Public Records
Map
Nearby Homes
- 2035 Arbor Forest Dr SW Unit 1
- 2063 Arbor Forest Dr SW
- 2065 Arbor Forest Dr SW
- 987 Kora Dr
- 1850 Winding Creek Ln SW
- 1882 Winding Creek Ln SW
- 2341 Habersham Dr SW
- 2540 Appaloosa Trail SW
- 1046 Wedgefield Dr SW
- 1126 Wedgefield Dr SW
- 1265 Channel Park SW
- 1214 Bonshaw Trail
- 2284 Ellis Mountain Dr
- 2261 Ellis Mountain Dr
- 1227 Bonshaw Trail
- 1045 Endeavour Ct
- 820 Nob Ridge Dr
- 994 Gentry Ln SW
- 1239 Bonshaw Trail Unit 3
- 2613 Lakefield Ct
- 2270 Brookmont Trace SW
- 2260 Brookmont Trace SW
- 2271 Camden Dr SW Unit 3
- 2028 Arbor Forest Dr SW
- 2030 Arbor Forest Dr SW
- 2026 Arbor Forest Dr SW
- 2261 Brookmont Trace SW
- 2250 Brookmont Trace SW
- 2024 Arbor Forest Dr SW
- 2269 Camden Dr SW Unit 3
- 2032 Arbor Forest Dr SW
- 2275 Camden Dr SW Unit 3
- 2240 Brookmont Trace SW
- 2251 Brookmont Trace SW
- 2201 Arbor Forest Trail SW
- 904 Clearbrook Course SW
- 2027 Arbor Forest Dr SW Unit 104
- 2027 Arbor Forest Dr SW
- 902 Clearbrook Course SW
- 2025 Arbor Forest Dr SW