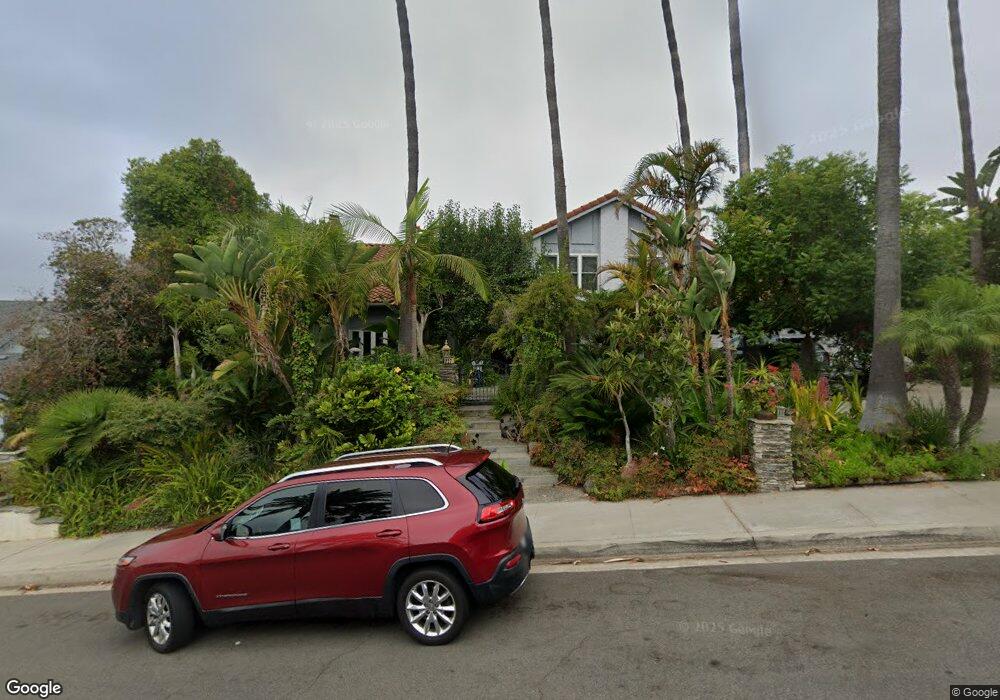
2271 Oceanview Rd Oceanside, CA 92056
Mira Costa NeighborhoodEstimated Value: $1,416,000 - $1,935,000
3
Beds
3
Baths
3,215
Sq Ft
$520/Sq Ft
Est. Value
About This Home
This home is located at 2271 Oceanview Rd, Oceanside, CA 92056 and is currently estimated at $1,673,382, approximately $520 per square foot. 2271 Oceanview Rd is a home located in San Diego County with nearby schools including Palmquist Elementary School, Martin Luther King Jr. Middle School, and El Camino High School.
Ownership History
Date
Name
Owned For
Owner Type
Purchase Details
Closed on
Jun 22, 2004
Sold by
Tibbals Pennington F Eleanore and Pennington Donald H
Bought by
Pennington Donald H and Tibbals Pennington F Eleanor
Current Estimated Value
Purchase Details
Closed on
Feb 20, 2004
Sold by
Tibbals Pennington F Eleanor and Eleanor Tibbals F
Bought by
Pennington Donald H and Tibbals Pennington F Eleanor
Home Financials for this Owner
Home Financials are based on the most recent Mortgage that was taken out on this home.
Original Mortgage
$500,000
Outstanding Balance
$231,073
Interest Rate
5.62%
Mortgage Type
Credit Line Revolving
Estimated Equity
$1,442,309
Purchase Details
Closed on
Feb 17, 1999
Sold by
Herz David C and Herz Marie E
Bought by
Tibbals F Eleanor
Home Financials for this Owner
Home Financials are based on the most recent Mortgage that was taken out on this home.
Original Mortgage
$200,000
Interest Rate
6.73%
Purchase Details
Closed on
Jan 10, 1992
Purchase Details
Closed on
May 27, 1987
Create a Home Valuation Report for This Property
The Home Valuation Report is an in-depth analysis detailing your home's value as well as a comparison with similar homes in the area
Home Values in the Area
Average Home Value in this Area
Purchase History
| Date | Buyer | Sale Price | Title Company |
|---|---|---|---|
| Pennington Donald H | -- | -- | |
| Pennington Donald H | -- | Ticor Title Company | |
| Tibbals F Eleanor | $420,000 | First American Title | |
| -- | $295,000 | -- | |
| -- | $272,000 | -- |
Source: Public Records
Mortgage History
| Date | Status | Borrower | Loan Amount |
|---|---|---|---|
| Open | Pennington Donald H | $500,000 | |
| Closed | Tibbals F Eleanor | $200,000 |
Source: Public Records
Tax History
| Year | Tax Paid | Tax Assessment Tax Assessment Total Assessment is a certain percentage of the fair market value that is determined by local assessors to be the total taxable value of land and additions on the property. | Land | Improvement |
|---|---|---|---|---|
| 2025 | $7,190 | $658,416 | $246,897 | $411,519 |
| 2024 | $7,190 | $645,506 | $242,056 | $403,450 |
| 2023 | $6,968 | $632,850 | $237,310 | $395,540 |
| 2022 | $6,861 | $620,442 | $232,657 | $387,785 |
| 2021 | $6,886 | $608,278 | $228,096 | $380,182 |
| 2020 | $6,673 | $602,042 | $225,758 | $376,284 |
| 2019 | $6,478 | $590,238 | $221,332 | $368,906 |
| 2018 | $6,408 | $578,666 | $216,993 | $361,673 |
| 2017 | $6,289 | $567,321 | $212,739 | $354,582 |
| 2016 | $6,084 | $556,198 | $208,568 | $347,630 |
| 2015 | $5,905 | $547,845 | $205,436 | $342,409 |
| 2014 | $5,675 | $537,114 | $201,412 | $335,702 |
Source: Public Records
Map
Nearby Homes
- 2210 Valley Rd
- 0 Oceanview Rd Unit NDP2504901
- 2128 Via Sonora
- 3225 Avenida de Loyola
- 2835 Valley Vista Way
- 3349 Par Dr
- 2360 Paseo de Laura Unit 2
- 2360 Paseo de Laura Unit 1
- 3315 Tripoli Way
- 2525 Woodlands Way
- 3328 Malta Way
- 2077 Tiffany Dr
- 2335 Cartegena Way
- 3376 Corsica Way
- 3315 Genoa Way Unit 96
- 3325 Genoa Way Unit 110
- 2619 Fire Mountain Dr
- 3365 Genoa Way Unit 135
- 3335 Genoa Way Unit 112
- 3529 Santa Maria St
- 2267 Oceanview Rd
- 2275 Oceanview Rd
- 2268 Valley Rd
- 2264 Valley Rd
- 2270 Valley Rd
- 2260 Valley Rd
- 2274 Valley Rd
- 2279 Oceanview Rd
- 2248 Oceanview Rd
- 2261 Oceanview Rd
- 2244 Oceanview Rd
- 2242 Oceanview Rd
- 2258 Valley Rd
- 2278 Valley Rd
- 2282 Valley Rd
- 2283 Oceanview Rd
- 2286 Valley Rd
- 2452 Carriage Cir
- 2251 Oceanview Rd
- 2265 Valley Rd
Your Personal Tour Guide
Ask me questions while you tour the home.